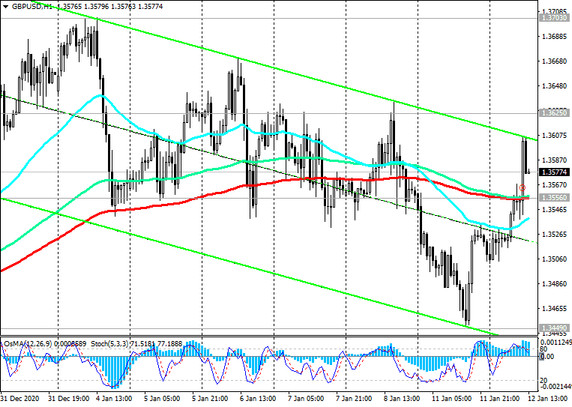
At the time of this article's publication, the GBP / USD pair is traded near 1.3580 mark, 70 pips above today's opening price.
At the very beginning of this year, the GBP / USD pair briefly exceeded the 2.5-year high and the 1.3700 mark, but then fell to within the weekly low and the 1.3449 mark, through which an important short-term support level (ЕМА200 on the 4-hour chart) is currently passing.
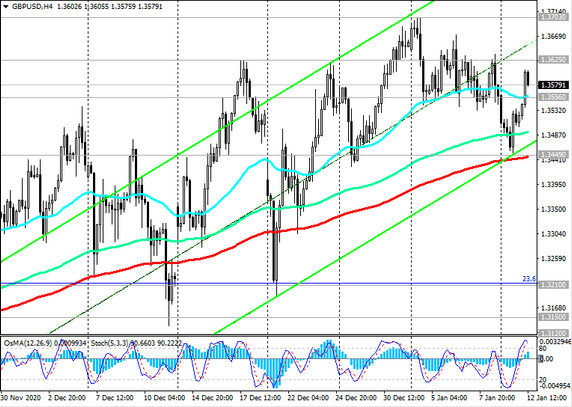
Above support levels 1.3556 (ЕМА200 on the 1-hour chart), 1.3449, GBP / USD purchases look safe, while the long-term positive dynamics of the pair remains above the key long-term support levels 1.3035 (ЕМА200 on the daily chart), 1.3150 (ЕМА200 on the weekly chart).
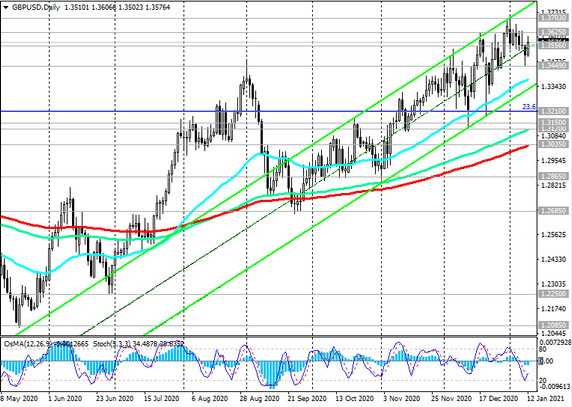
It is still possible to continue growth, a breakdown of the local resistance level of 1.3700 and reaching resistance levels of 1.3960 (Fibonacci level 38.2% of the correction to the decline of the GBP / USD pair in the wave that began in July 2014 near the level of 1.7200), 1.4440 (ЕМА144 on the monthly chart), 1.4580 (50% Fibonacci level).
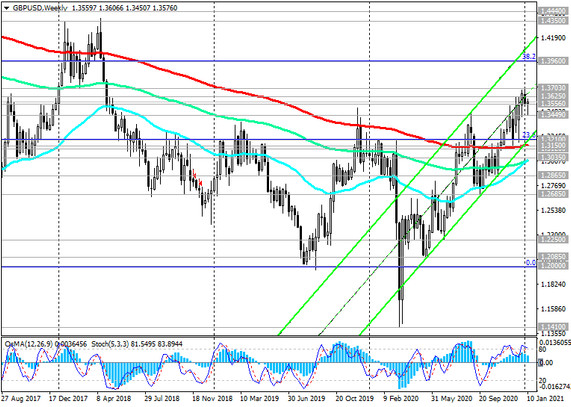
In the alternative scenario, and after the breakdown of the support level 1.3449, one should expect a decline towards the support levels 1.3120 (ЕМА144 on the daily chart), 1.3035 (ЕМА200 on the daily chart). A breakdown of the local support level 1.2685 (September lows) will increase the risks of a resumption of the global bearish trend in GBP / USD and may provoke a deeper decline towards the support levels 1.2250, 1.2085, 1.2000 (Fibonacci level 0%).
The first signal for the implementation of this scenario may be a breakdown of the support level 1.3556.
Support levels: 1.3556, 1.3500, 1.3449, 1.3400, 1.3300, 1.3210, 1.3150, 1.3120, 1.3035, 1.2865
Resistance levels: 1.3625, 1.3700, 1.3900, 1.3960
Trading recommendations
Sell Stop 1.3530. Stop-Loss 1.3615. Take-Profit 1.3500, 1.3449, 1.3400, 1.3300, 1.3210, 1.3150, 1.3120, 1.3035, 1.2865
Buy Stop 1.3615. Stop-Loss 1.3530. Take-Profit 1.3625, 1.3700, 1.3900, 1.3960

