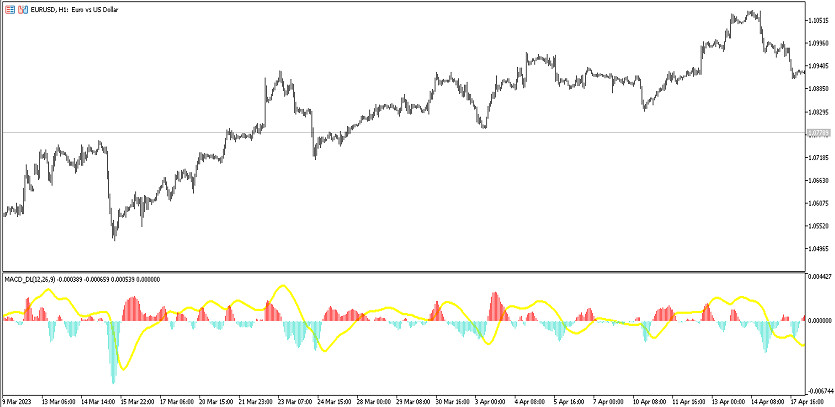
The MACD Dl 2 Colors indicator is a trading algorithm based on a modification of the standard forex MACD indicator using double smoothing, namely two DI signal lines. This indicator is used to determine the current trend and its strength, which in turn allows opening a specific trade. It is presented in the lower window of the price chart as a colored histogram with a signal line. Thus, it should be taken into account that the indicators of the histogram and its signal line are the main ones in determining the current trend and opening trades in this period.
The MACD Dl 2 Colors indicator is suitable for use on any timeframe, with any currency pair.
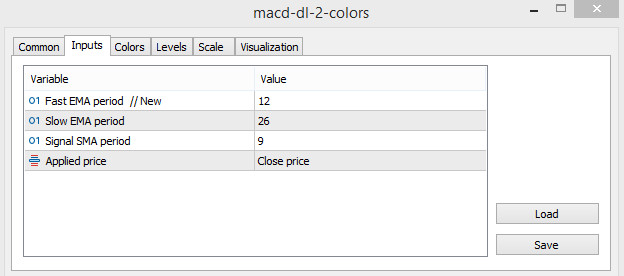
Input parameters
The settings of the MACD Dl 2 Colors indicator consist of several sections, which in turn affect its overall functioning. For example, the Input Parameters section is used to set the values of its technical work, the Colors section is used to change its general visualization, including the color gamut and the thickness of the values. To add signal levels to the indicator window, the Levels section is used.
-Fast EMA period - the period for calculating the fast exponential moving average of the indicator. The default value is 12.
-Slow EMA period - the value of the period of the slow exponential moving average. The default value is 26.
-Signal EMA period - period of the signal line of the indicator. The default value is 9.
-Applied price - a type of price to which indicator calculations are applied. Close price by default.
Indicator signals
The MACD Dl 2 Colors indicator is very easy to use, as its application algorithm is similar to other histogram indicators, including its standard version. To open a trade, it should be determined the strength and direction of the current trend using the color and direction of the histogram and the signal line of the indicator. If the indicator determines an upward trend, long positions are opened, in a downward trend, short positions are opened. In both cases, when the current trend changes, trades are closed.
Signal for Buy trades:
- At least three columns of the histogram have a growth color and a new column is formed above the previous one. Together with the signal line, they are located above level 0.
Upon receipt of such conditions on a bullish candle, a buy trade can be opened, due to the presence of an upward trend in the current market. The trade should be closed upon receipt of the opposite conditions, namely, when the direction and color of the histogram change. At this moment, the current trend is expected to change, which in turn will allow considering the opening of new trades.
Signal for Sell trades:
- The indicator is located above level 0 and has a color with a growth value. At the same time, the new column of its histogram is lower than the previous one.
A sell trade can be opened immediately upon receipt of such conditions that characterize the presence of a downward trend in the current market. When the trend direction changes, namely when the opposite conditions are received from the indicator, the current trade should be closed and opening new ones should be considered.
Conclusion
The MACD Dl 2 Colors indicator is an accurate trading algorithm, as its calculations are based on an improvement of the standard version of the MACD indicator, the accuracy of which has been proven by time. The indicator is very easy to use and is suitable even for beginners who can strengthen their trading skills with preliminary practice on a demo account.