

As we noted above, the S&P 500 is again testing the important support level 3815.0 (ЕМА50 on the daily chart) today, while maintaining a tendency to decline on short-term time frames.
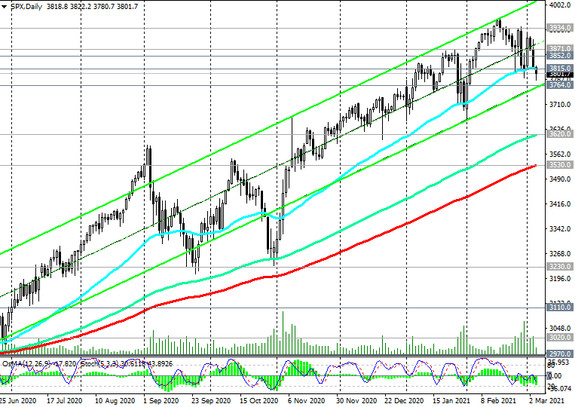
The closest target of the decline is the support level 3764.0 (the lower line of the ascending channel on the daily chart). Its confirmed breakdown will open the way for a decline towards the key support levels 3620.0 (ЕМА144 on the daily chart), 3530.0 (ЕМА200 on the daily chart). However, such a scenario is still unlikely. In general, the long-term bullish trend of the S&P 500 and the American stock market in general remains.
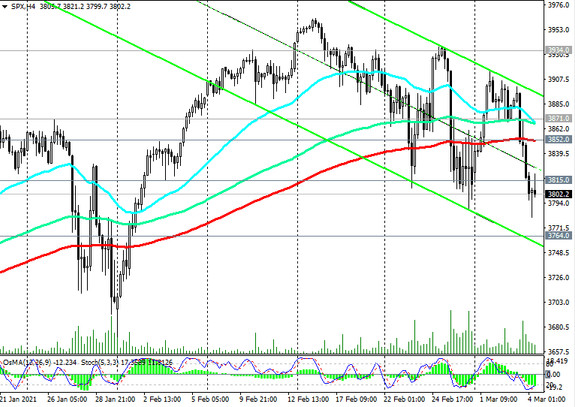
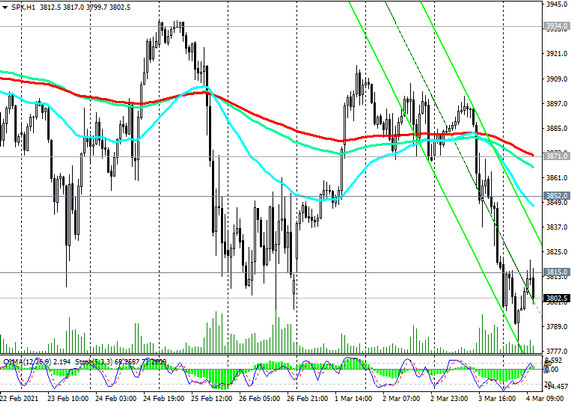
However, for a safer renewal and build-up of long positions, it is necessary to wait for the S&P 500 to return into the zone above the important short-term resistance levels 3852.0 (EMA200 on the 4-hour chart), 3871.0 (EMA200 on the 1-hour chart).
The breakdown of the local resistance level 3934.0 will confirm the accuracy of our forecast for further growth in the S&P 500.
Support levels: 3764.0, 3620.0, 3530.0
Resistance levels: 3815.0, 3852.0, 3871.0, 3934.0, 4000.0
Trading recommendations
Sell Stop 3778.0. Stop-Loss 3825.0. Targets 3764.0, 3670.0, 3620.0, 3530.0
Buy Stop 3825.0. Stop-Loss 3778.0. Targets 3852.0, 3871.0, 3934.0, 4000.0


