
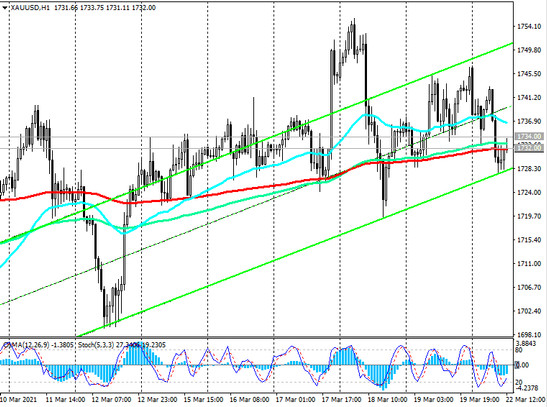
So, finding support at the level 1732.00 (ЕМА200 on the 1-hour chart), the XAU / USD pair turns up at the beginning of today's European session. If the growth continues, the nearest target will be the resistance level 1762.00 (ЕМА200 on the 4-hour chart).
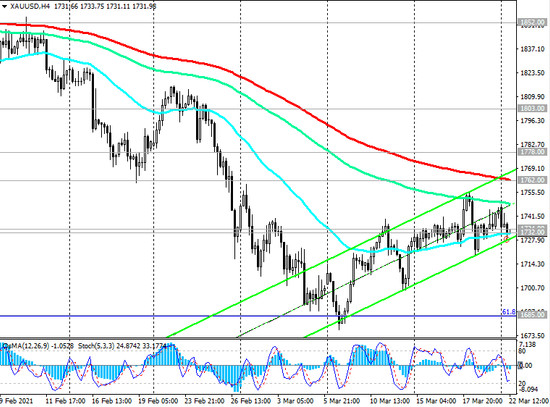
Its breakdown will confirm the end of the XAU / USD downward correction and direct it to the key and long-term resistance level 1803.00 (ЕМА200 on the daily chart), above which long positions will become relevant again.
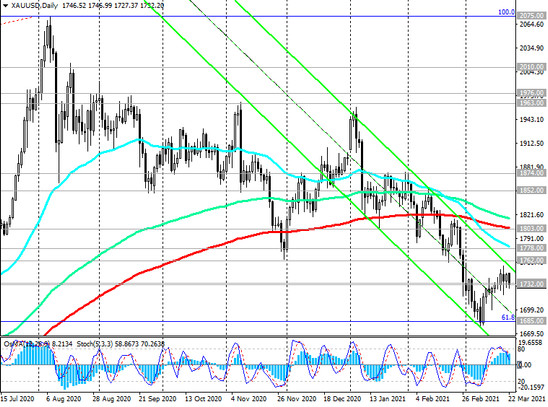
In an alternative scenario, the breakdown of the support levels 1732.00 and 1728.00, 1720.00 (local lows) will resume the downward dynamics of XAU / USD, which is still within the descending channels on the daily and weekly charts.
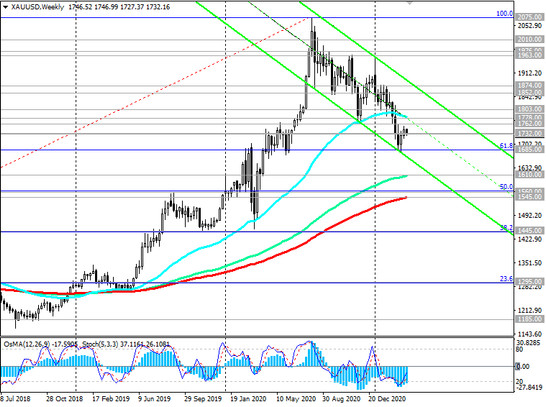
A breakdown of the important support level 1685.00 (local multi-month low and Fibonacci level 61.8% of the correction to the growth wave since November 2015 and the mark of 1050.00) will strengthen the downtrend and send XAU / USD towards support levels 1610.00 (ЕМА144 on the weekly chart and the lower border of the descending channel on the daily chart), 1560.00 (Fibonacci level 50%), 1545.00 (ЕМА200 on the weekly chart).
And in case of their breakdown, XAU / USD will go towards the key support levels 1295.00 (Fibonacci level 23.6% and ЕМА144 on the monthly chart), 1185.00 (ЕМА200 on the monthly chart) separating the long-term bullish trend from the bearish one.
Support levels: 1732.00, 1728.00, 1720.00, 1685.00, 1610.00, 1560.00, 1545.00
Resistance levels: 1762.00, 1778.00, 1803.00, 1810.00, 1852.00, 1874.00, 1963.00, 1976.00, 2010.00, 2075.00
Trading recommendations
Sell Stop 1726.00. Stop-Loss 1744.00. Take-Profit 1720.00, 1685.00, 1610.00, 1560.00, 1545.00
Buy by market, Buy Stop 1744.00. Stop-Loss 1726.00. Take-Profit 1762.00, 1778.00, 1803.00, 1810.00, 1852.00, 1874.00, 1963.00, 1976.00, 2010.00, 2075.00


