In a busy week for the Antipodean currencies, where both the RBA and RBNZ held monetary policy meetings, we got a surprise 50bp hike from New Zealand while the RBA held rates unchanged in Australia. The surprisingly large hike from the RBNZ pushed the AUDNZD pair some 150 pips down and below the 1.06 level. However, the move is already reversing, and AUDNZD is back above 1.06, perhaps as a signal that the bears are not fully in control of this market here.
Indeed, the 1.05 area represents important support in AUDNZD, and the current levels are near this area. The rejection of lower levels this week is the first solid signal that the support here is likely to hold.
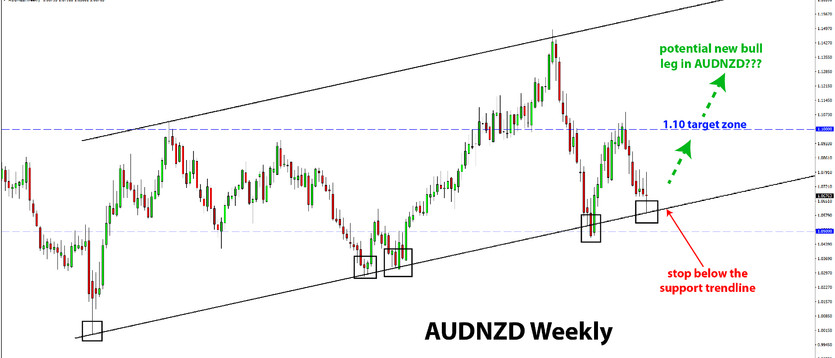
AUDNZD testing weekly support area
The weekly chart shows us that AUDNZD has connected a support trendline with the past 3-4 major lows from March 2020, September-November 2021, and December 2022 (see image below). This trendline is now a verified and solid support. Assuming it continues to hold, and considering the February AUDNZD peak around 1.10, it’s safe to say that a 1.05 - 1.10 range looks like a fairly probable scenario for the pair over the coming weeks and months.
With AUDNZD now trading near the bottom and support of this potential range, we should be on the lookout for attractive setups to enter long. The current weekly candle already shows a sharp rejection of lower levels and could close tomorrow as a doji candlestick. Or a close above 1.07 would complete a bullish candlestick pattern and would already be a signal for a long trade in the current context with AUDNZD at support.
Trade Plan
Entry:
- Look for a bullish pattern on the weekly chart that should give a bullish signal (as described above);
- A close above 1.07 would provide such a bullish signal.
Stop loss:
- Below the weekly trendline; below 1.05
Target:
- 1.10 area
- Longer term, 1.12 and 1.15 can be targeted in a larger bullish scenario


