When you want to start trading, you need to learn to identify when a trend is occurring.
Your ability to predict or recognize when an uptrend or downtrend is actually occurring will inevitably dictate how successful your trading career is going to be.
However, if you still don’t know how to do this, you needn’t fret, for I am here to illustrate just that!
What’s A Trendline?
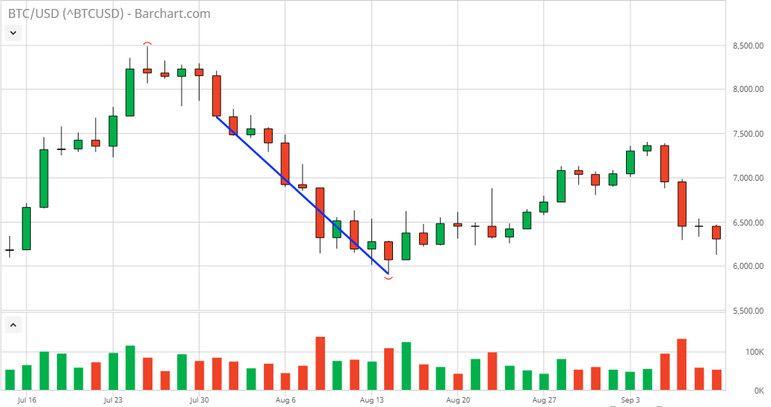
A trendline is a simple line drawn through a point of the candlesticks, be it the top, bottom or middle of the candle. It’s as simple as that.
Trendlines are one of the most important tools of technical analysis as they the basis for many other technical trading concepts and patterns. In fact, nearly all technical traders use trendlines, even if they’re not visually representing it, and most do so subconsciously.
A trendline is drawn between two or more points on a chart. The direction of this line accurately illustrates the direction of the trend in the majority of cases across all the different markets whether it’s Forex, stocks, cryptocurrencies or other assets.
As you can see, the line identifies that the graph is showing a downward trend. If we drew the line from the low point in the middle of the chart and connect the next low point to the right, it would show an upward trend.
Remember that we said most traders draw trendlines subconsciously?
Well…
Have a look at this chart:
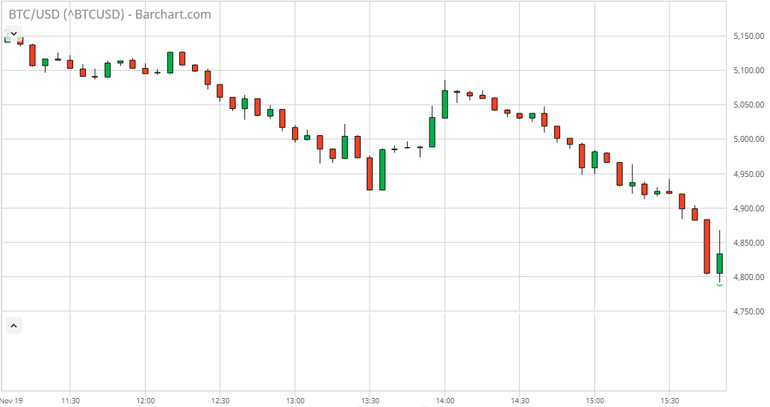
Can you tell in which direction this trend is going?
I bet everyone can spot the fact that that’s a fairly obvious downtrend with a brief break, and it’s simple because you see no repeating resistance; that’s you creating an imaginary trendline!
Advantages Of Using Trendlines
But, what happens when the trend is a bit sketchier and you have more trouble spotting the real direction?
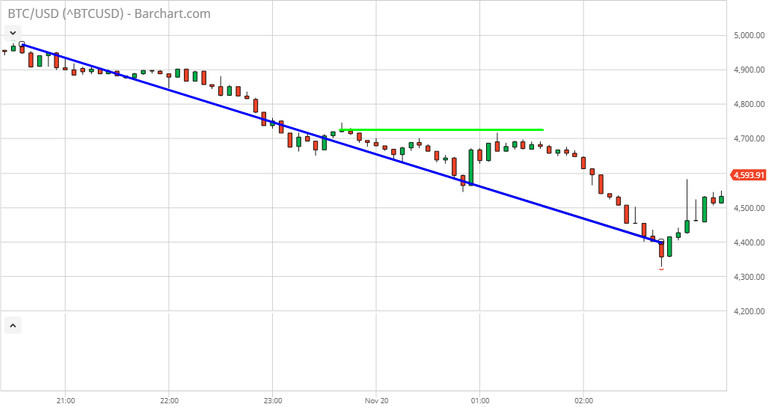
Look at this trend. Many people would believe that the downward trend was broken by a consolidation period if they judged by the resistance levels (highlighted green).
Nevertheless, if we drew a trendline from one point to the other, we’d quickly notice that the overall direction of the trend is downwards, but with a brief slowdown in the middle.
In the end, the main advantage of trendlines is that they help you spot trends more easily when there are apparent breaks among the overall trend.
The overall ability to determine this direction will let you:
- Know which position to open - whether to go long or short - or even if you want to refrain from even opening a position in case of a sideways trend.
- Stay focused on the real stability of the trend in case of brief breaks like the one shown above; this will prevent you from exiting a trade too early.
Trading With Trendlines
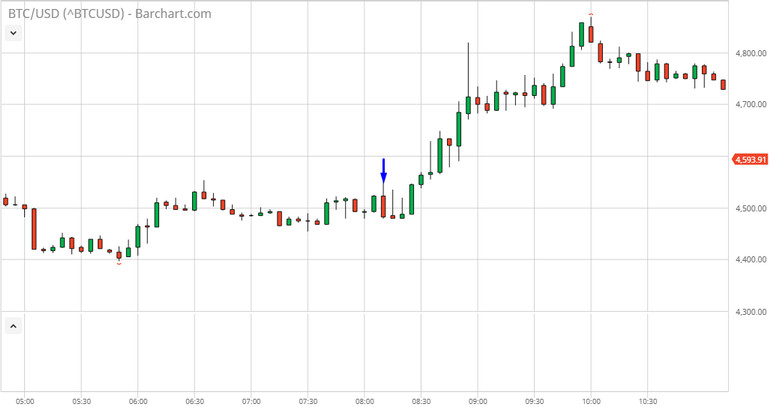
Let’s suppose we are sitting at this candle in the middle of the chart (blue down arrow) and we are looking to open a position. However, the preceding candles are a bit difficult to identify because we can see that the price has been consolidating, and we don’t want to trade a consolidation period.
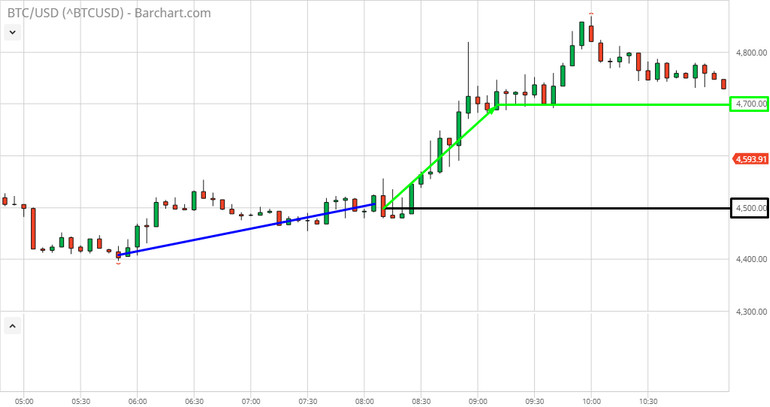
But, if we draw a trendline we can easily see that we are inside of an uptrend judging from the slope of the line. This would be an indication that long positions would be attractive at this point, and as we can see from the chart above, the market indeed rose after that.

