Rounding Tops and Bottoms:
Rounding tops and bottoms are reversal patterns that form slowly and gradually, but once fully completed the eventual reversal is clearly evident and highly likely to occur.
It’s interesting to note that rounding formations will often appear together with other technical reversal patterns, like head and shoulders, double tops or bottoms, wedges etc.
More precisely, classical reversal patterns will tend to appear inside of the rounding formation as part of the overall turn in the market sentiment.
When this occurs it’s a stronger signal that the reversal will be genuine as multiple price levels and tools can now be used to confirm the validity of the reversal.
The rounding top and bottom formations should visually be roughly symmetrical, although of course perfect symmetry can be seldom expected in the real market.
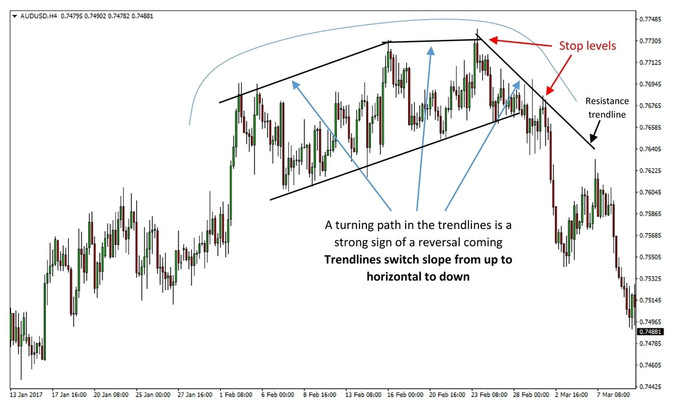
The rounding formation will be usually outlined by a turning path in the trendlines highlighting the reversal of the prior trend. That is, in a rounding top the slope of the trendlines will change from up, to horizontal and finally, it will turn south sloping down just before the breakdown to confirm the reversal.
In a rounding bottom, the trendlines will follow exactly the same pattern only of course in the opposite order.
All the rules and tactics that apply to a rounding top pattern are the same and should be applied to the rounding bottom pattern in reverse order, thus we will describe the approach for trading the patterns by using the bearish rounding top pattern.
Entry rules:
Initial Stop-Loss placement:
- Above the highest high of the rounding top formation (this is the ultimate stop out level).
- Or, alternatively, the stop can be placed behind the most recent swing high (keep in mind that although the risked amount is smaller with this approach it’s also more likely that the stop will be taken out before the trade moves in the desired direction).

AUDUSD 4h chart - Rounding top
Trade management:
If a resistance trendline is present toward the completion of the pattern (there usually is), then it should not be broken if the reversal is going to be genuine. Closing the trade is recommended if price returns back above the resistance trendline (in a bearish rounding top) and below the support trendline (in a bullish rounding bottom).
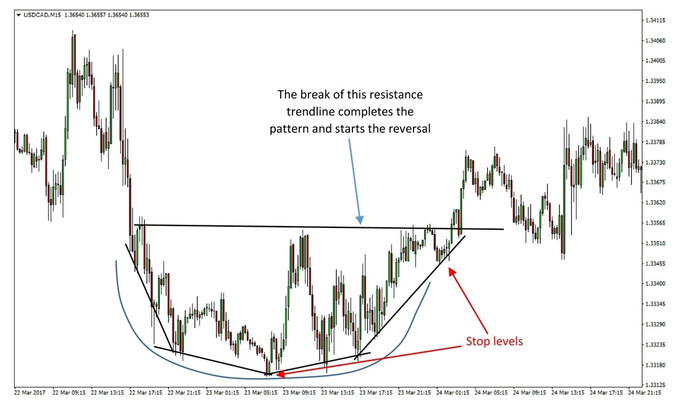
The bullish case of the pattern is shown on the USDCAD chart below. Notice how the trendlines here took a turn from steep down to gradual down to gradual up and finally to a steep upward slope.

USDCAD M15 chart - Rounding bottom
Profit-Targets:
- There is no reliable approach to set profit targets based on the rounding top formation alone. However, we can use any other accompanying pattern to set profit targets (remember the rounding top pattern usually appears together with other technical patterns).
- If no other patterns have formed, then support or resistance levels from higher timeframes can be used as reliable targets as is the case with most technical trading strategies.
- The trader must be aware of the potential risk-reward and always aim for a ratio of at least 1:1 or even better a 1:2 risk – reward ratio.
Triple Tops and Bottoms:
The triple top and the triple bottom are similar to the double top and double bottom patterns. In fact, a triple top consists of a double top plus one top just as a triple bottom consists of a double bottom plus an additional swing low.
Yet, it’s fair to say that the triple top and triple bottom are somewhat more reliable than the double top and double bottom. After all, resistance that holds 3 times is stronger than resistance that holds twice, right?
A triple top is formed when price fails to break a double top, or better said fails to break below its neckline and instead runs for the highs one more time. Hence, it follows that the same rules for drawing the neckline on a double top or bottom pattern apply for drawing necklines on triple tops and bottoms as well.
The triple top and bottom patterns often appear together with, or as part of a larger range. In such situations, both patterns should be examined to arrive at a better judgment of the overall situation on the chart.
All the rules and tactics that apply for a triple top pattern apply for the triple bottom pattern as well, only in inverted order. We will describe the approach for trading the patterns by using the bearish triple top example.
Entry rules:
Additionally, it’s wise to take a look at Momentum oscillators and look for confirmation of the triple top pattern. Particularly bearish divergence on the oscillators can confirm that the prior uptrend is indeed slowing down and hence a bearish reversal is more likely.
Initial Stop-Loss placement:
- Behind the highest top of the 3 tops (this is the ultimate stop out level).
- Or, alternatively, the stop can be placed behind the most recent swing high (for a tighter stop).

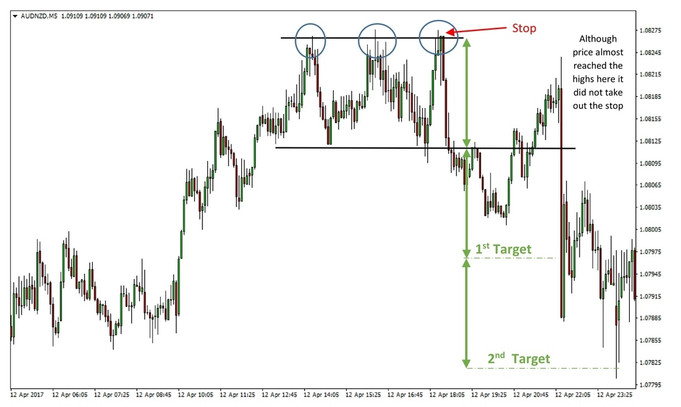
A triple top pattern on the AUDNZD 5m chart
Trade management:
Although, it doesn’t automatically negate the whole pattern price should not return back above the neckline on a close after it already broke it to the downside. If that happens it’s a warning sign that the pattern may fail.
The above 5m AUDNZD chart was an example of this situation, however, the pattern still worked in the end and price reversed.
After breaking below the neckline price should move in the breakout direction soon and in an orderly manner. If the price is just consolidating after breaking the neckline and possibly even coming back to it several times and playing with it then those are warning signs that the trade might not work out as planned.
Profit targets:
- Measure the vertical distance between the neckline and the highest point of the 3 tops / bottoms.
- 1st target - Project this measurement from the neckline to the right of the chart.
- 2nd target – Project 2x the 1st target.
- 3rd target – Project 3x the 1st target.
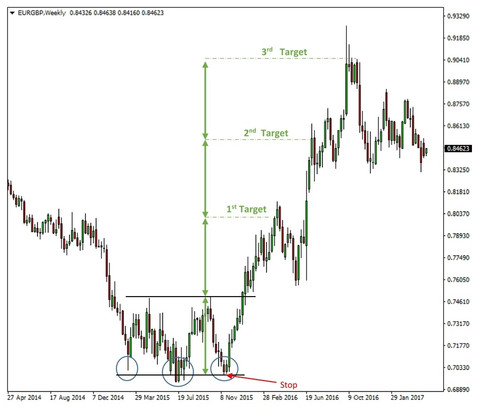
The bullish triple bottom is shown in the EURGBP example below. Notice how the pattern works exactly the same on the weekly timeframe as it does on the 5-minute timeframe.

EURGBP Weekly chart - Triple bottom


