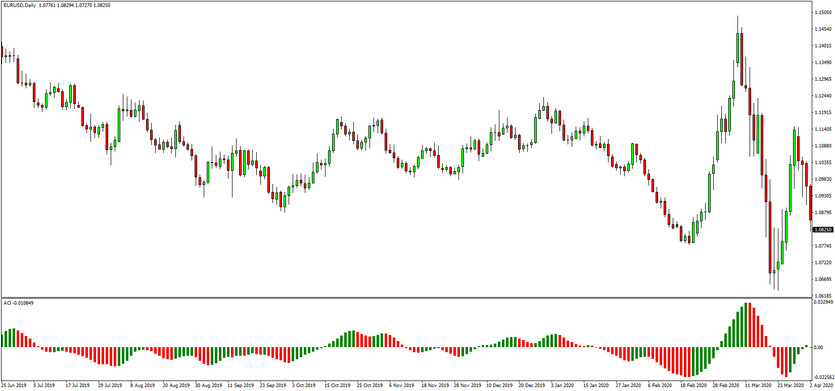
For some of us, the term “Awesome Oscillator” (AO) may definitely not ring a bell. But if you’re someone who gets up in the morning for trading forex, awesome oscillator is music to your ears. Probably, you may even consider it as one of your most significant tools in your forex trading strategy.
About the Author of the Awesome Oscillator
Bill Williams, the man behind the existence of this powerful trading tool. He redefined the forex trading indicators for creating an easy way to reflect the precise changes in the market driving force, and helped countless people in their journey to the forex world.
Definition of the Awesome Oscillator
By its simplest definition, the awesome oscillator is an indicator that shows market momentum personified by a histogram graph. This indicator is intended to show what’s happening in the market for a defined period of time, and some traders use its signals for buying and selling decisions.
It is a tool widely used by forex traders in the market, and if used and interpreted wisely, it will be the best way to have eyes and ears in the field. It will help you recognize whether it is a good time to go long or short, or close your opened trades.
The advantage of being familiar with this indicator is that it provides lots of important signals. This is ideal for traders who want to take advantage of every opportunity, and want to optimize their trading strategies. It’s best suited for trend traders, and can also be merged with other type of indicators to have stronger market analysis.
How the Awesome Oscillator works
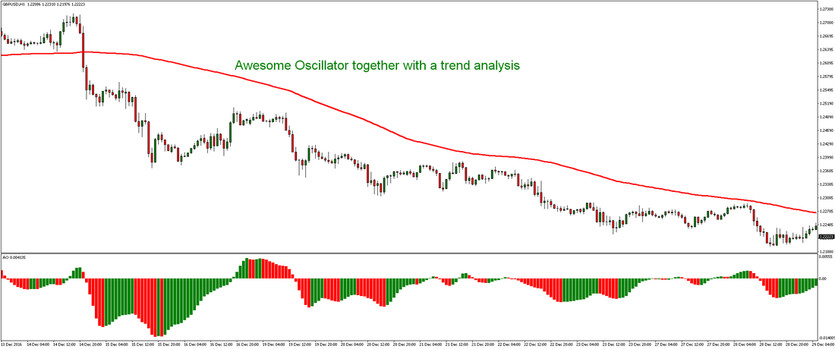
Structurally, it works by comparing two sets of Simple Moving Averages (SMA), a 34-period simple moving average and a 5-period simple moving average, and these lengths can be modified depending on your desire.
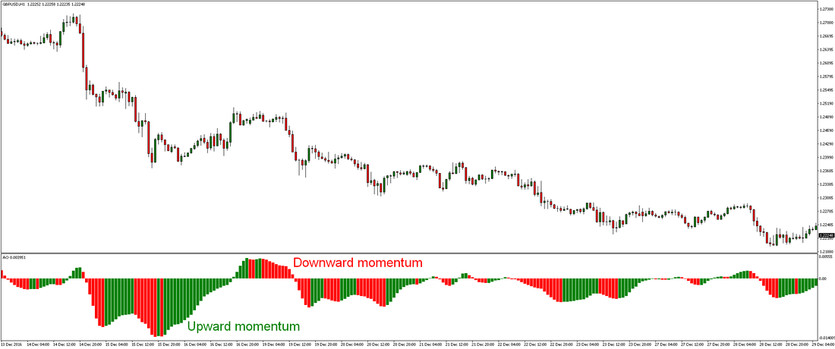
In most of the graphs, momentum is indicated and classified regarding the color of the bars. Green bars indicate that it’s higher than previous, showing upward momentum, while on the other hand, red lines indicate that momentum is lower than the previous, showing downward momentum.
Trading with the Awesome Oscillator
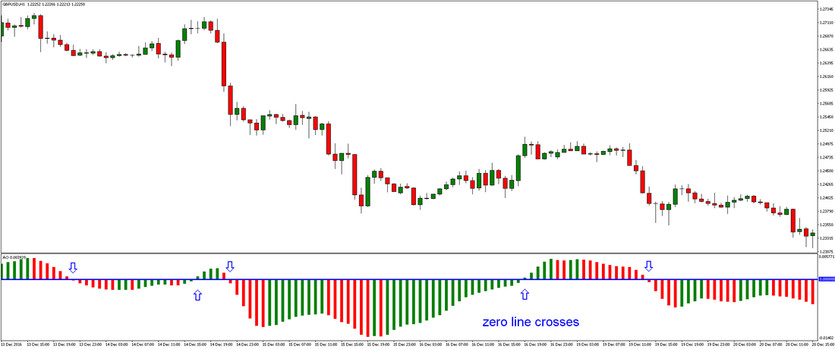
When interpreting AO, the simplest way is to observe when the bar goes through the zero line, or the “Naught line”. It is a useful indicator to determine the momentum changes in the market driving force, and is often the basis for using the next forex indicators to confirm market entries or exits.
Simply told, bars below the zero line are signaling a bearish trend, while bars above the zero line are signaling a bullish trend. The zero line can be be considered as a trend changer.
“Saucers” occur when the bar chart changes direction briefly in a move. If the market is going down, the bar chart is below the naught line, you wait until there are at least two green candles, followed by another red one. This means that the market will likely go down, and is the best time to sell. This can also be applied reversely, where it is the best time to buy.
In case of this type of signal, it is important to analyze current market structure, and avoid range markets. In strong trends, this signal usually works the best.
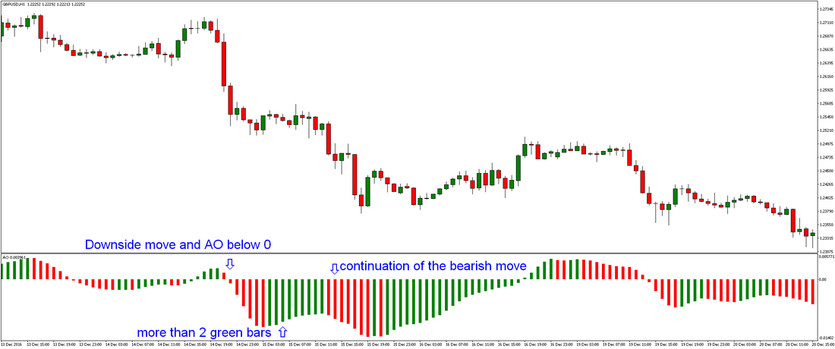
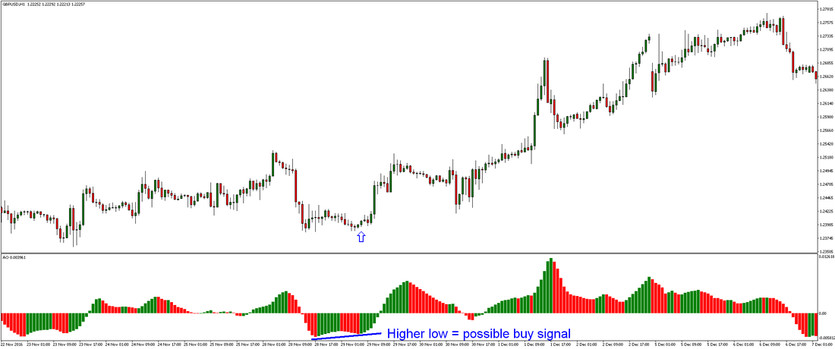
A “twin peak” takes place when the bars in the histogram show two humps in the direction they’re going. When below the naught line, pointing downwards (with the lowest minimum) is followed by another downward-pointing pike that is somewhat closer to the zero line; this is the only signal to buy that falls below the zero line. And reversely, the same goes when selling.
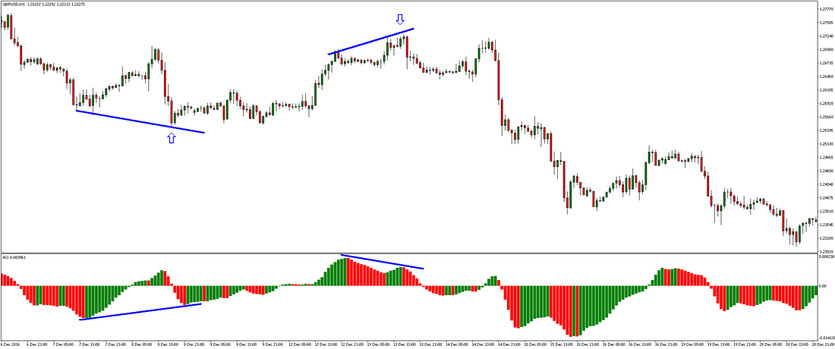
And like with other oscillators, divergence signals are very popular among forex traders. In the chart below, you can see both bullish (the first one) and bearish (the second one) divergences. Divergences can be simply defined as a different behaving of price swings and indicator's highs and lows. For example, if a price is making two lower lows while the indicator's second low is higher, there is a bullish divergence. And reversely for bearish divergence.
However, there are also "hidden" bullish and bearish divergences. Hidden bullish divergences take place if a price is making higher low, while the indicator's second low is still lower. Reversely for bearish divergence.
Conclusion
These are only some of the basic signals when using the awesome oscillator. A wise use of this indicator may lead you to a walk in the park in your trading journey. And if you’re beginning with forex trading, hopefully, this basic knowledge may help you pave the path to your trading success.

