Trend trading is a market approach that aims to profit from larger and momentum-driven market moves.
One of the main arguments behind this style of trading is that although the market may spend 70 or 80 percent of the time in ranges, still those 20 percent of the time in which the market is trending offer the best and most profitable trading opportunities.
And indeed, that is probably not far from the truth. There is a general principle in life - commonly known as the 80/20 rule which states that 80% of the results usually come from 20% of the input (work). There is hardly any strong argument that can prove this statement wrong in trading, so it’s a good statistic to keep in mind. Normally, for most traders, about 80% of the profits will come from about 20% of the trades.
But the biggest advantage with trend trading probably is the fact that the probabilities are tilted in your favor right from the start. And this is also why a lot of traders prefer this approach to trading the Forex market.
While in other trading styles the probabilities may be about 50/50 to get the trade right, in trend trading these probabilities are already stacked in favor of the direction of the predominant trend. When you are trend trading the market, the question is never which direction you should enter the market. The direction is already well-known and the only question that the trader needs to answer is what would be a good entry and exit price in order to capitalize on the overall trending move.
Like range trading that we discussed last week, trend trading has its own specific characteristics and certain advantages and disadvantages as a result. As a result, certain tools and techniques tend to work very well in trend trading and our best bet to profit is to leverage these tools and maximize the results.
Technical analysis tools to determine the trend
To trade a trend you first have to find one on the charts. So, let’s see how you can define a trend and which technical tools can help you do that.
Naked price action is very revealing
The most basic analysis to do is look at a naked candlestick chart without any indicators on it. Detecting a trend in this way is usually obvious. For example, a series of green or red candles are obviously part of an uptrend or a downtrend and it will for sure cause the other technical indicators to show a trend.
However, telling the state and strength of the trend is not that easy with a naked chart and that’s why traders generally need to use some of the technical indicators that can do that.
Moving averages to define the trend and as support and resistance
Moving averages are a great trend trading tool. There are many different combinations of moving averages that have been systemized and are preached constantly by the so-called experts. Regardless of which moving averages strategy you use, if you are using it during a trend the strategy/system will likely be profitable.
In essence, moving averages can be used in two ways – as a crossover signal system and as a dynamic support/resistance area. Both can be used to determine the current trend in the market, but generally, the dynamic support/resistance approach can provide more information about the state of the trend. It is also a leading indicator compared to the lagging nature of crossover systems.
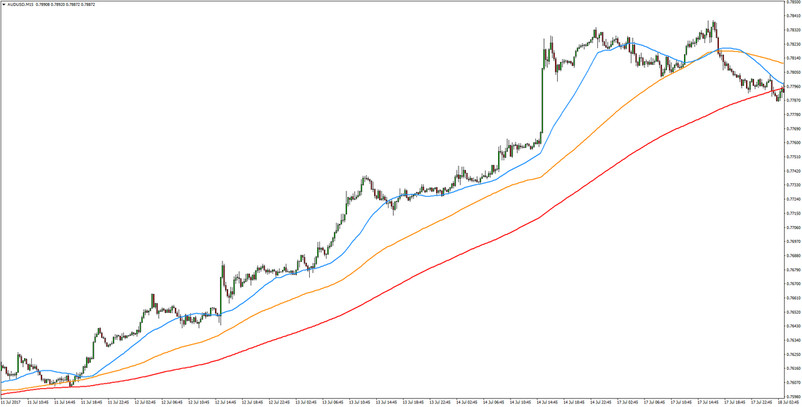
Below is an example of 3 moving averages plotted over a trending market. A strong trend is in place when the moving averages are pointed in the same direction and lined up in order - from the fastest to the slowest.

A 15-min AUDUSD chart - The 34, 55 and 100 period moving averages are in order and pointed up
ADX
The ADX is a great tool for trend trading also. It’s probably one of the most complete technical indicators as it can be used both in range and in trend trading strategies.
The main idea with the ADX is to look for its values to be above 25 as a confirming sign that a trend is in place. The greater the ADX’s reading the stronger the trend’s momentum is. Also, a falling ADX line is a sign that the trend is losing momentum while a rising ADX line can indicate strengthening momentum.
The ADX line is not affected by the direction of the trend, its only purpose is to show the health/strength of the trend.
Keep the overall context in mind
If a strong bullish trend appears on the 1-hour chart but there is a strong resistance level on the Daily chart then you better pay attention to that resistance. Support or resistance on a larger timeframe can stop and reverse a trend on the smaller timeframes.
Context must be taken into account whenever you are considering a trade and the larger timeframes always are more significant than the lower timeframes.
Strong trends are almost always accompanied by strong underlying fundamentals
It can be tricky to determine if a market move is a genuine trend by using technical indicators alone. Sometimes the market starts moving fast only for that sharp move to turn out to be part of a correction.
By devoting time to understand the fundamental factors that drive currency trends, a trader will be much better equipped to deal with these situations more appropriately.
Strong trends in the currency market rarely happen without strong underlying fundamentals to drive that trend. That is to say, the fundamentals will be strongly in favor of one currency (the one that’s rising) compared to the other (the currency that’s falling).
In most cases during a strong trend, the fundamentals are obvious and the investment world is talking about the hot currency and how it will continue to rise.

Positions should be maintained during retracements in a trend
General guidelines for trend trading the Forex market Never chase the price!
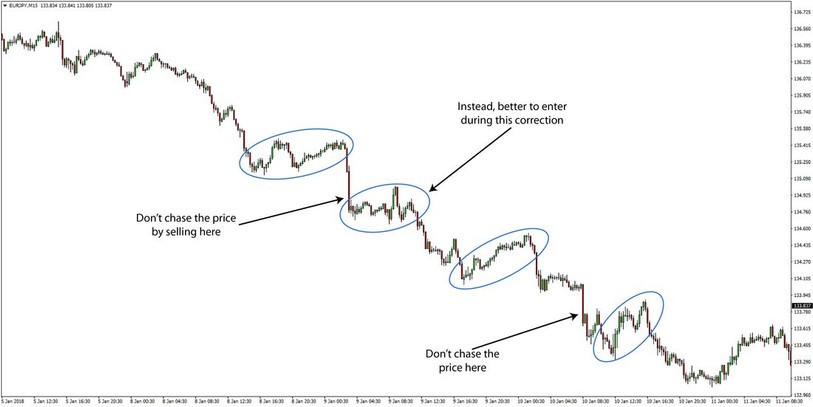
If you’ve missed your opportunity it’s rarely smart to enter at a price that’s worse than you originally planned to enter at. When you chase the price your profit target automatically gets smaller and your stop loss bigger which results in a much worse reward/risk ratio.
Profitable traders never chase the price after they miss an opportunity. Instead, they wait and look for the next opportunity where they can join the move.
Stay in through the corrections
Many times during the trend the market will take a correction, often fast and sharp in nature which scares off a lot of traders and they prematurely exit the trade. Then the market takes off without them. This is probably one of the worst experiences for a trader – almost the same as a losing trades.
Opposite to range-trading, trend traders need to hold their positions and avoid taking small quick profits. Of course, it’s up to your indicators and your analysis to determine correctly when you should hold a position through a correction and when you should exit. Nevertheless, in more cases than not in a trend, it’s prudent and wise to stay in the trade while the correction is taking place because you can never know exactly when the market will take another leg in the direction of the predominant trend.
In fact, the worst time to exit a trend trade is during the correction because the market almost never reverses completely without looking back. That is to say, if the trend is up and the market suddenly starts going down it’s unlikely that you won’t see another push higher, even if the market does reverse to the bearish side in the end.
Of course, as with all trades, you always need to have a stop in place and a price level that says you are completely wrong.


