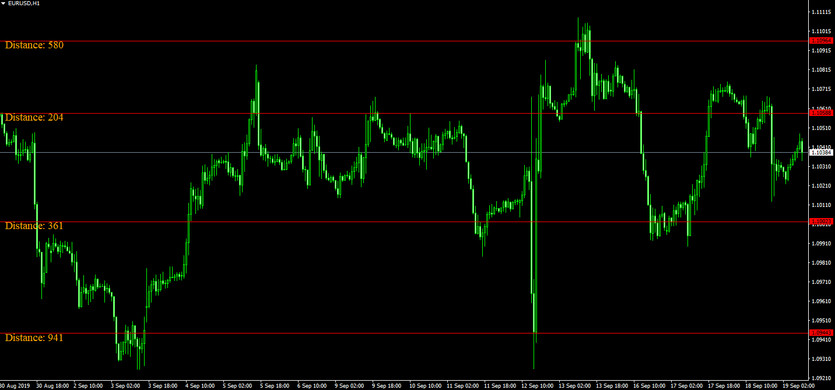
This indicator for MT4 calculates and displays the distance between the line drawn on the chart and the current price.
This can be very helpful for people who often draw horizontal lines on the chart. Using this indicator is also recommended for those who use breakout strategies.
Look at the image above. Like in the image, this indicator automatically calculates and displays the distance when you draw the horizontal line. The distance numbers are in pipettes (1/10th of a pip).
Tips on how to use:
1. Use "LineDistance" to determine profit and stop loss levels.
Let's draw a horizontal line in the price range where you want to determine target/stop levels. This indicator automatically calculates the distance from the price to this horizontal line, so you can more precisely see how far you are from reaching the profit-making / loss-cutting point. This can make risk and profit estimation easier.
2. This indicator is also suitable for breakout strategies.
Let's draw a horizontal line where you want to breakout trade and intend to Place an order when this price range is exceeded. The distance between the price and the horizontal line is now automatically calculated, so you can know how far is your target just by taking a glance.
For example, suppose the current ATR is 300 pipettes and the distance from the price to the horizontal line is 600 pipettes. In this case, a reasonable estimation can be that this price range may be reached in about two hours.
Compatibility: MT4
Parameters: None
Download the "LineDistance" MT4 indicator from the button below
Tip: Can’t open the downloaded archive file (ZIP or RAR)?
Try WinRAR for Windows or The Unarchiver for Mac .
Do you need help with installing this indicator into MT4 for Windows or Mac OS? Our guide HERE will help you.


