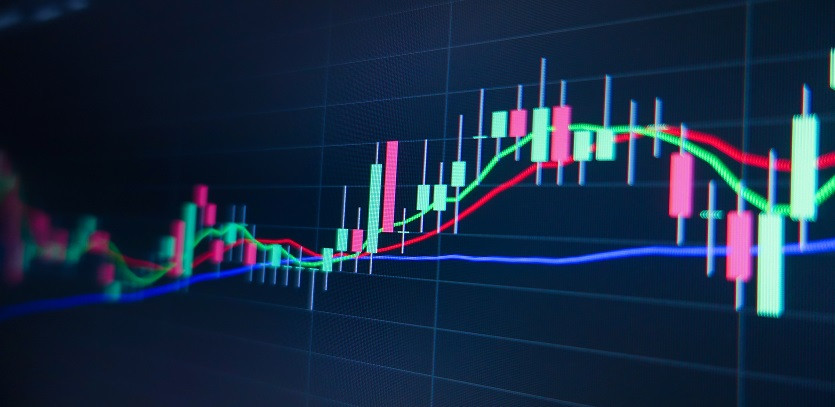
Candlestick charts are a type of technical analysis chart that shows the opening, closing, high, and low prices of a security over a period of time. Each candle represents one trading day, and the different colors of the candles represent whether the market closed higher or lower than it opened.
Candlestick charts are a popular tool for traders because they can provide a lot of information about the market in a single glance. For example, the length of the candle can indicate the strength of the market, while the color of the candle can indicate whether the market is bullish or bearish.
Types of Candlestick Patterns
There are many different types of candlestick patterns, each with its own unique meaning. Some of the most common candlestick patterns include:
Hammer: A hammer is a bullish candlestick pattern that forms when the market opens lower, rallies sharply, and then closes near the high of the day. Hammers are often seen as a sign of a potential trend reversal.
Piercing Pattern: A piercing pattern is a bullish candlestick pattern that forms when the market opens lower, gaps down, and then rallies to close above the open of the previous day. Piercing patterns are often seen as a sign of a strong bullish trend.
Bullish Engulfing: A bullish engulfing pattern is a bullish candlestick pattern that forms when a small bearish candle is engulfed by a larger bullish candle. Bullish engulfing patterns are often seen as a sign of a strong bullish trend reversal.
Morning Star: A morning star is a bullish candlestick pattern that forms when three consecutive candles form in a specific pattern. The first candle is a long bearish candle, the second candle is a small candle, and the third candle is a long bullish candle. Morning stars are often seen as a sign of a trend reversal.
Three White Soldiers: Three white soldiers is a bullish candlestick pattern that forms when three consecutive long bullish candles form. Three white soldiers are often seen as a sign of a strong bullish trend.
How Candlestick Patterns Influence Trading
Candlestick patterns can be used to identify potential trading opportunities. For example, a hammer can be seen as a sign of a potential trend reversal, while a piercing pattern can be seen as a sign of a strong bullish trend.
However, it is important to remember that candlestick patterns are not always reliable. The market can often move in unexpected ways, so it is important to use candlestick patterns in conjunction with other technical analysis tools.
How to Choose the Right Trading Candle
The right candle for you will depend on your trading style and risk tolerance. If you are a short-term trader, you may want to use candlestick patterns that have a shorter time frame, such as the 15-minute or 30-minute chart. If you are a long-term trader, you may want to use candlestick patterns that have a longer time frame, such as the daily or weekly chart.
It is also important to consider your risk tolerance when choosing a candle. Some candlestick patterns are more risky than others. For example, the morning star is a relatively low-risk pattern, while the three white soldiers is a relatively high-risk pattern.
Many experts believe that candlestick patterns can be a valuable tool for traders. However, they also caution that candlestick patterns should not be used in isolation. It is important to use candlestick patterns in conjunction with other technical analysis tools and to always consider the overall market environment.
Conclusion
Candlestick charts are a powerful tool that can provide traders with a lot of information about the market. However, it is important to remember that candlestick patterns are not always reliable. The market can often move in unexpected ways, so it is important to use candlestick patterns in conjunction with other technical analysis tools.


