Introduction to Keltner Channels
Keltner Channels serve as a robust tool for day traders, offering insights into current market trends and potential trading signals. These channels are crafted by integrating volatility metrics with average price data, resulting in a trio of lines that evolve with price fluctuations, sketching out a channel-like visualization.
History and Calculation of Keltner Channels
Keltner Channels originated from Chester Keltner's work in the 1960s. However, it was Linda Bradford Raschke's updates in the 1980s that made them what they are today.
These channels merge two foundational indicators: the exponential moving average (EMA) and the average true range (ATR). While the EMA offers a weighted average price over a given period, prioritizing recent prices, the ATR measures volatility. J. Welles Wilder Jr. was the mind behind ATR, unveiling it in his 1978 publication, "New Concepts in Technical Trading Systems."
Here's the formula for the Keltner Channels:
- Upper Band = EMA + (ATR x chosen multiplier)
- Middle Band = EMA
- Lower Band = EMA - (ATR x chosen multiplier)
For day traders, an EMA between 15 to 40 is standard. The ATR multiplier can be adjusted, but a value of 2 is commonplace.

Fine-tuning the Keltner Channels
Keltner Channels, with their dynamism and adaptability, are the day trader’s compass. But, like any compass, precision and calibration are key. To ensure that this tool doesn't lead you astray, the secret lies in its fine-tuning.
Deciphering Price Movements:
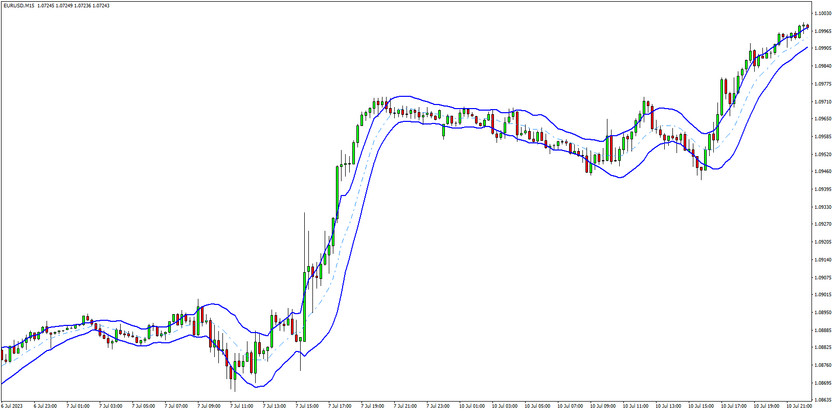
- Uptrend Recognition: When the price nudges, or even breaks through, the upper band while remaining comfortably above the lower band, you're witnessing an uptrend.
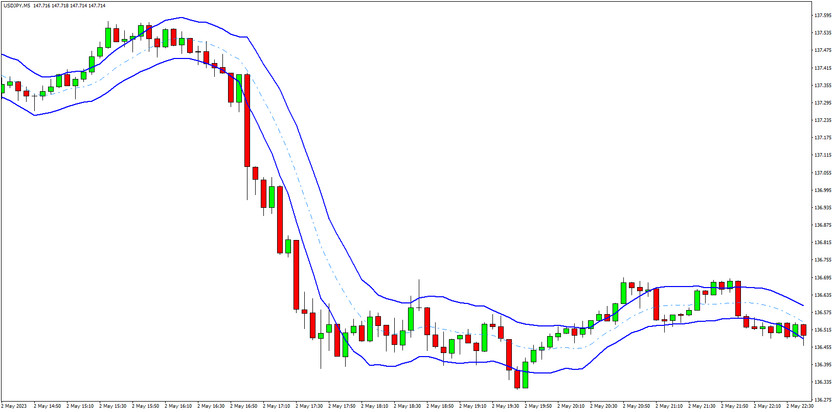
- Downtrend Indicators: The price gravitating toward the lower band, possibly even breaching it, but consistently staying below the upper band, signals a downtrend.
Calibrating with Multipliers: Adjusting the multiplier not only changes the width of the channels but can also influence your trading insights.
- Standard Multiplier: 2 is commonly chosen by traders.
- For Increased Sensitivity: Opt for a slightly lower value like 1.7.
- For Decreased Sensitivity: A value like 2.3 may be more appropriate. This provides a broader outlook, capturing major price shifts without being perturbed by minor volatilities.
Adapting the Exponential Moving Average (EMA): The flexibility of the EMA setting lets you align the channel with specific market conditions.
- For Rapid Market Movements: A shorter EMA, say around 15, might be your ally.
- For a More Holistic View: Stretching the EMA to around 40 can provide a comprehensive look into the trend.
Harmonizing with Other Indicators: Integrating Keltner Channels with other indicators can provide a multi-dimensional view.
- Relative Strength Index (RSI): Perfect for identifying overbought or oversold conditions in tandem with the Keltner's trend signals.
- Moving Average Convergence Divergence (MACD): It provides momentum insights, highlighting potential entry and exit points in synergy with Keltner's channels.
Regular Evaluations: Markets evolve, and so should your tools. It's paramount to periodically reassess your Keltner settings, ensuring they resonate with the current market temperament.
Remember: Calibration is a personalized journey. What works for one trader might not be suitable for another. Hence, it’s crucial to test, adjust, and refine until you find the Keltner settings that resonate with your trading style and the asset you're focusing on.
Implementing the Trend-Pullback Strategy
With a properly set up Keltner Channel, the primary strategy focuses on buying during an upward trend when prices regress to the middle line. It's vital to set a stop loss mid-way between the middle and lower bands and target the upper band. Conversely, in a downtrend, a short-sell approach should be adopted.
Remember, it's crucial not to trade all pullbacks. The trend-pullback strategy only flourishes when a discernible trend exists. Continual oscillation between the two bands indicates an ineffective application of the method.
Exploring the Breakout Strategy
Harnessing the power of the Keltner Channels, the breakout strategy is an audacious approach to ride the waves of explosive market movements. Let's delve deeper and style your understanding of this intriguing technique.
Timing is Everything:
- Prime Time Alert: The first 30 minutes after a major market opens is a golden window. This period often witnesses the most dynamic movements, making it an opportune moment for this strategy.
Reading the Bands for Breakout Signals:
- Going Bullish: Initiate a buy when the price surges above the upper band.
- Adopting a Bearish Stance: Sell short as the price plummets below the lower band.
Exiting the Game:
- The Middle Band Directive: The center band of the Keltner Channel serves as your exit beacon. Irrespective of your trade position—whether in profit or loss—exit the moment this band is touched.

Maximizing Opportunities and Minimizing Risks:
- Sequential Strategy: Post an initial signal, if the trade culminates in a minor profit or loss, brace yourself. Another signal might be on the horizon. However, limit yourself to two trade signals during the first half-hour post market opening. If fortune doesn't favor during these two attempts, it’s unlikely to do so later.
- Choosing the Right Assets: Not all assets are cut out for this strategy. Focus on assets known for sharp trending moves during the morning. Tame assets with subdued morning actions are less likely to yield fruitful breakouts.
Pitfalls and Precautions: Trading during the initial market hours is like navigating through turbulent waters. One must be cautious as:
- High volatility can sometimes mislead.
- Relying solely on this strategy for assets that are generally stable during mornings can be counterproductive.
Remember: The breakout strategy isn’t about predicting the market's direction. It's about reacting swiftly and intelligently to its evident movement. Just as surfers don’t create waves but ride them masterfully, traders employing the breakout strategy should be poised to seize the momentum when the tide turns in their favor.
Synchronizing Trend-Pullback and Breakout Approaches
Keltner Channel strategies can be harmonized for maximum effectiveness. After employing the breakout strategy, traders can switch to the trend-pullback strategy, depending on market dynamics. Being versatile and adaptive with the strategies is the key to unlocking their potential.
Words of Wisdom
Different assets may necessitate unique Keltner Channel adjustments. Before plunging into live trading, practicing on demo accounts will bolster your confidence and refine your strategy. Only trade with real money once you've consistently mastered the techniques in practice sessions.
FAQs
What purpose do Keltner Channels serve? Keltner Channels furnish traders with a visual snapshot of an asset's average price behavior and volatility, enabling them to pinpoint potential trading opportunities and predict trend shifts.
How should Keltner Channels be configured for scalping? Effective scalping necessitates more agile settings. While the principles remain unchanged, a scalper might adjust the focus with settings like an 8 EMA on a 15-minute timeframe.


