US Dollar Fundamental Outlook: Bullish Factors Prevail, but Most Already Priced In; Scope for USD Consolidation Near-Term
It will be a slow start to the week in the Fx market as many traders are off for the Easter holidays. The calendar doesn’t look particularly busy either, so the general trends that were in force in recent weeks are likely to extend into this week’s trading
The greenback finished the past week stronger, but only marginally so, despite the robust jobs reports last Friday. A lot of the “good news” was already in the USD’s price as many economists and investors expected strong numbers for Friday’s NFP report. While, on balance, the fundamentals remain dollar bullish, the currency may need a new catalyst to take it higher, given the recent repricing and shift in expectations. Without a new bullish catalyst, the dollar may spend some time consolidating in the near term, though it should retain a slight bullish undertone even in such a scenario.
The week ahead features the FOMC minutes and a speech from Fed’s Chair Powell. However, it’s not likely there will be a big market reaction around those events. The IMS services report is going to be released later today (April 5) and should confirm the positive outlook for the US economy. Still, any larger price reactions, if any at all, may be delayed for later in the week.
Euro Fundamental Outlook: Europe Is in Holiday Lockdowns; EUR Getting No Love from Investors
Not much changed for the single currency over the past week, and the established negative fundamentals took the currency to fresh cycle lows versus the US dollar and pound sterling. Moreover, the inflation prints disappointed slightly, anchoring the expectations for very dovish ECB monetary policy for a very long time.
The uneventful EUR calendar for the current week provides little scope for things to change in the near-term. EUR traders will continue to focus on the epidemiological situation in the region and the progress with vaccinations. The EU will have to improve on these two fronts before the euro currency is able to find a more durable bottom on the charts.
EURUSD Technical Outlook:
The 1.1750 support zone in EURUSD held last week, and the pair is now trading near 1.18 again.
Nonetheless, EURUSD bulls are far from being out of the woods yet. The pair remains in a downtrend that is defined by the 1.20 resistance zone. Only a breakout above 1.20 would change the picture to bullish on the weekly chart.
The bearish channel remains largely intact and points to the 1.16 area as the projected destination. 1.16 is also the first important support for EURUSD to the downside.
British Pound Fundamental Outlook: UK Economy Starts to Reopen as COVID Cases and Deaths Plunge
The GBP calendar for this week is also very quiet, with no major events scheduled. The UK is also on holiday for Easter since Friday, so GBP volatility is likely to be subdued in the first part of this week.
The rapid and effective vaccine rollout in the UK has helped the currency tremendously. The British pound is the best performing currency for Q1, with many traders expecting the trend to continue into Q2. Last week’s GDP report was better than expected, attesting to the positive “vaccine effect” on the UK economy. And for good reasons, it appears. The 7-day average of new COVID infections and deaths in the UK is the lowest since September, while over 60% of adults have received at least one shot of a COVID vaccine.
With the Government now starting to lift the restrictive measures in a well-defined plan that should set the UK free from COVID restrictions by June 21, the positive effects should already be visible in the economic data in the following weeks. Therefore, the underlying fundamentals for GBP remain positive. GBP may consolidate on a broad basis in the shorter-term, though much like the dollar, that is likely to transpire with a bullish undertone.
GBPUSD Technical Outlook:
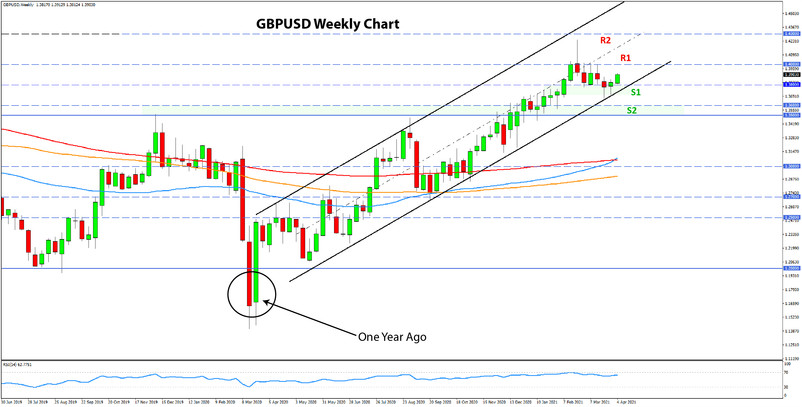
After it bounced from the 1.37 – 1.3750 support area two weeks ago, GBPUSD is making its way above 1.39 this week. The bullish channel formation that goes back one year, therefore, remains intact. If GBPUSD makes a new cycle high within this formation, then levels toward 1.45 will likely be reached.
On the other hand, however, the 1.40 area is likely to remain a big hurdle as it is a significant resistance zone. The bulls may penetrate it, but a true breakout will only come with a confirmed weekly close above it.

Japanese Yen Fundamental Outlook: JPY Remains the Underdog, but Betting on Further JPY Weakness Could be a Dangerous Game
The JPY was the weakest currency in the major Fx space for another week as it remained pressured by risk appetite and elevated bond yields. Nothing on the horizon suggests that this could change any time soon, which means the Japanese yen is likely to remain an underperformer versus its peers.
That being said; however, it pays to be vigilant and note potential dangers with these trends. Namely, a large part of the move has probably already unfolded, with JPY positioning moving toward an overcrowded short exposure. Furthermore, USDJPY and 10Y US Treasury yields (to which USDJPY is closely correlated) are at a significant resistance area. These factors together are a warning sign for this JPY bearish trend.
The Japanese calendar and economic data will not be a major factor for JPY’s direction, as has been the case for much of recent history.
USDJPY Technical Outlook:
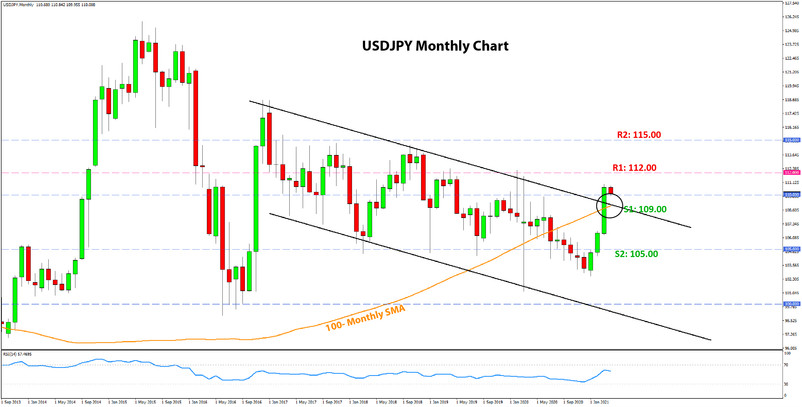
USDJPY closed the month of March above 110.00. According to the chart we provided two weeks ago, this qualifies as a bullish breakout above the resistance line of the 4-year channel formation. To strengthen the case further, March was also the end of Q1, so this is also a breakout on the quarterly chart.
BUT. With all that being said (and observed), let’s talk about Fakeouts.
1) While the monthly close above the trendline and above the 110.00 level is technically a breakout, the momentum wasn’t as powerful (though not weak) as in other cases.
2) The 112.00 high from the onset of the Coronavirus panic (February/March 2020) represents significant resistance. That area is not far from the current levels.
3) There hasn’t been a rejection of lower levels below 110.00 yet to serve as confirmation for the breakout.
Now that we have issued the warning, let’s talk about the key S/R zones. Obviously, 112.00 is the key nearest resistance. The nearest support is at 110.00, but the crucial one that needs to hold to validate this breakout is at 109.00. The 109.00 zone is significant because it’s where the 200-month MA and the broken trendline meet.


