Contrary to popular belief, it's not a requirement for forex strategies to be maddeningly complex for them to yield returns. A simple approach, such as employing a strategy that uses three moving averages, could put you on track to being a consistently successful forex trader.
Say goodbye to the chaos of intricate lines and perplexing indicators cluttering your trading terminal. Keep it clean, straightforward, and you can pocket enough pips to enjoy regular profitability—without losing your sanity.
Let's delve into the simple yet effective world of the three moving average forex strategy. With this strategy, the standard Simple Moving Average (SMA) and Exponential Moving Average (EMA) indicators on your MetaTrader 4 (MT4) platform become potent tools, facilitating a crossover strategy that helps you trade forex like a seasoned professional.
A Crash Course on Moving Average Crossovers
The crossover strategy leverages multiple moving averages to identify optimal trading entries at the intersection or "crossover" of these lines.
In this strategy, we trigger trade entries when faster moving averages cross paths with slower ones. A third MA is then employed to ensure you align your trades with the broader trend. Crossover trading strategies are as straightforward as they are effective.
Before we delve deeper into this three moving averages trading strategy, let's recap some moving average basics.
Understanding Moving Averages
What is a Moving Average?
Moving averages, a staple in technical analysis, are used to identify trends by smoothing out price fluctuations. They provide a clearer picture of overriding trends by filtering out market noise, making them an integral part of any trading platform.
A moving average is computed by averaging the closing price of a currency pair over a specific period, marking the points on your chart, and then linking these plots with a line. They use historical price data to forecast future prices.
Types of Moving Averages
There are two commonly used moving averages:
- Simple Moving Average (SMA)
- Exponential Moving Average (EMA)
Simple Moving Average (SMA)
A simple moving average is calculated by summing the closing prices for a pre-set period and then dividing that sum by the total number of prices.
Exponential Moving Average (EMA)
An exponential moving average is designed to give more importance to recent data. Consequently, recent prices have a higher influence on the average than older prices, ensuring that the line isn't significantly affected by an irrelevant outlier.
Lengths of Moving Averages
The length of the moving average, or the number of periods used in the calculation, affects how the moving average line appears on your chart.
Both shorter and longer moving averages have their pros and cons. But combining them in a three moving average forex strategy allows you to enjoy the benefits of both.
Implementing the Three Moving Averages Forex Strategy
In this strategy, we utilize crossovers to determine optimal entry points—that is, when a shorter moving average crosses over a longer one.
We've opted for simple moving averages (SMAs) rather than exponential moving averages (EMAs) in this strategy. However, there's no definitive "right" or "wrong" when it comes to selecting moving averages for your strategy. Test both and see which aligns best with your trading style.
The three moving averages employed in this strategy are:
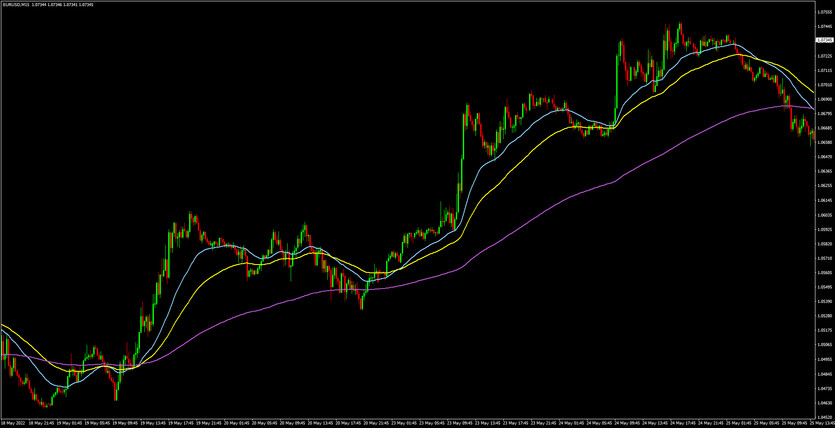
- 15 SMA – Yellow
- 30 SMA – Blue
- 100 SMA – Violet
We use these three SMAs to avoid some of the false signals associated with a two moving average strategy. This approach provides an additional layer of confirmation and ensures that we're trading in harmony with the larger trend.
With the final thought in mind, this technique can be particularly beneficial if you have a patient temperament and are content to wait for high-quality, high-probability trading signals. Your overall strategy will greatly benefit from this, as you are using a simple method to spot dominant trends and ride them until their culmination.
When using the 3 moving averages forex trading strategy, you'll essentially be using three different moving averages of varying lengths. Here is a simple breakdown:
- Short-term moving average - This is the shortest of the three moving averages and reacts fastest to price changes. It helps to identify the beginning of a new trend. You might use something like a 5-day EMA.
- Medium-term moving average - This moving average is slower to react to price changes than the short-term moving average. It can help you confirm the new trend identified by the short-term moving average. For instance, a 20-day EMA could serve this purpose.
- Long-term moving average - The longest of the three, this moving average is the slowest to react to price changes. It helps you to identify the primary trend. You might use a 50-day EMA as your long-term moving average.
So, how do you trade with these three moving averages?
- Identify the trend - The long-term moving average can help you identify the primary trend. If the price is above this moving average, you are in an uptrend, and if it is below, you are in a downtrend.
- Confirm the trend - The medium-term moving average can help you confirm the trend identified by the long-term moving average. If the price and the short-term moving average are above this moving average, you have further confirmation of an uptrend. If they are below, you have further confirmation of a downtrend.
- Enter the trade - The short-term moving average can help you find an entry point for your trade. If this moving average crosses above the medium-term moving average in an uptrend or below the medium-term moving average in a downtrend, you have a potential entry point.
- Exit the trade - You could use the short-term moving average to exit the trade. If this moving average crosses back below the medium-term moving average in an uptrend or above the medium-term moving average in a downtrend, it could be a signal to exit the trade.

This is a basic implementation of the 3 moving averages strategy. However, it's essential to remember that this strategy, like any other, isn't infallible. You should always use risk management techniques and take into account the overall market conditions when trading. Consider backtesting your strategy on historical data to see how it might have performed before implementing it with real money.
I hope this breakdown of the 3 moving averages strategy has been helpful to you. Remember, trading involves risk and is not suitable for everyone. Always ensure you are informed and comfortable with your strategy before you begin trading.
Once you have an understanding of the 3 moving averages strategy, you can begin exploring ways to fine-tune it or combine it with other indicators to enhance its performance.
- Use additional indicators: While the moving averages provide a good indication of the market trend and potential entry and exit points, they can sometimes give false signals. To minimize this, you can use other technical indicators to confirm the signals. For example, the Relative Strength Index (RSI) can help you identify overbought or oversold conditions, and the MACD can confirm trend changes.
- Adjust the lengths of the moving averages: The lengths of the moving averages used in the strategy are not set in stone. You can adjust them based on the currency pair you're trading, the timeframe, and your trading style. For example, if you're a day trader, you might use shorter-length moving averages.
- Combine with price action analysis: Moving averages can provide a broad picture of market trends, but price action can give you more nuanced information. By studying candlestick patterns and support and resistance levels, you can refine your entry and exit points.
- Implement risk management techniques: Regardless of the strategy you use, risk management is critical. Always ensure that you set stop-loss orders to limit your potential losses and take-profit orders to secure your gains when the price moves in your favor.
Remember, there's no "one size fits all" strategy in forex trading. It's essential to backtest any new strategy or adjustment on historical data to gauge its potential effectiveness before implementing it in live trading.
Trading involves risk and isn't suitable for everyone. Always ensure you're informed and comfortable with your strategy before you start trading.
Moving averages, defined
An important aspect of technical analysis in trading, moving averages are prevalent on all MT4 trading platforms and can be tailored to fit each unique trading approach.
Fundamentally, moving averages help traders to identify trends by minimizing abrupt fluctuations in price. They manifest as smooth lines on your chart, clearing out market noise, and permitting you to perceive price in terms of predominant trends.
It's worth mentioning that while your trading platform will conduct all calculations, moving averages are essentially determined by averaging the closing price of a currency pair over a fixed period, plotting those points on your chart, and then connecting them with a line.
This function of moving averages allows you to predict future prices by assessing past ones.
Examining Types of Moving Averages
Moving averages are primarily divided into two categories:
- Simple Moving Average (SMA)
- Exponential Moving Average (EMA)
Understanding Simple Moving Average (SMA)
A simple moving average is ascertained by summing up the final predetermined period of closing prices and dividing that total by the number of prices.
For instance, consider a 5 period, simple moving average on an hourly EUR/USD chart:
First, you add up the closing prices of the last 5 hours: 1.1000 + 1.1100 + 1.1200 + 1.1300 + 1.1200 = 5.5800
Then you divide this total by the number of prices: 5.5800 / 5 = 1.1160
Understanding Exponential Moving Average (EMA)
Unlike a simple moving average, an exponential moving average provides more weight to the latest data.
This signifies that the most recent prices will influence the average more heavily than those prices from the start of your predetermined period.
For example, if a significant price spike occurs due to a data release or a fat finger trade, the exponential moving average's weighting ensures that the line isn't skewed by an irrelevant outlier.
This specific reason is why many moving average strategies opt to use the EMA instead of the SMA.
No need to stress over calculations – your trading terminal has got you covered!
Understanding Lengths of Moving Averages
When we talk about the predetermined period of closing prices, we are referring to the length of the moving average.
The length of the moving average could also be described as the number of reporting periods used to calculate the average. This length influences how the moving average line appears on your chart.
- Shorter length moving averages
A fewer number of closing prices are incorporated into the calculation of the moving average, causing the moving average line to stay closer to the current price, resulting in sharper moves that traders can utilize. However, if used alone, they might not be as effective in identifying significant, long-term trends.
- Longer length moving averages
A greater number of closing prices are included in the calculation of the moving average, resulting in a smoother moving average line that is slower to respond to price changes. This is more helpful when identifying overall trends because one price doesn't have a significant impact on the overall average.
If used independently, however, the moving average line might become too smooth, and trends might not even be identifiable.
As you can see, both shorter and longer length moving averages have their advantages and disadvantages when used alone. But by incorporating them together in a 3 moving average forex strategy, you can harness the strengths of both types and use them to your advantage.


