The EURUSD currency pair is the most liquid and most traded instrument in the Forex market. It, therefore, attracts a lot of attention from retail traders as well as pros, such as the big banks and institutions that professionally trade Fx.
If you are familiar with the Forex market to some degree, you probably already know or have come to understand that every currency pair behaves slightly differently on the charts, even when it looks similar. In a way, every currency pair has its own unique personality and most often behaves in line with this “personality”.
In this article, we will discuss strategies and patterns that are based on some of these unique characteristics of EURUSD which can be used specifically on the charts of the EURUSD currency pair. EURUSD normally has very consistent patterns on the charts and the price action is usually moving in an orderly manner. Chaotic price action is rare and probably you will only see it when big events catch the market off guard and surprise traders.
EURUSD also often trades in very well-defined channels across the different timeframes and charts, so keeping an eye on that perspective is also very valuable. Breakouts also often provide good trading opportunities. Support and resistance levels generally tend to hold well.
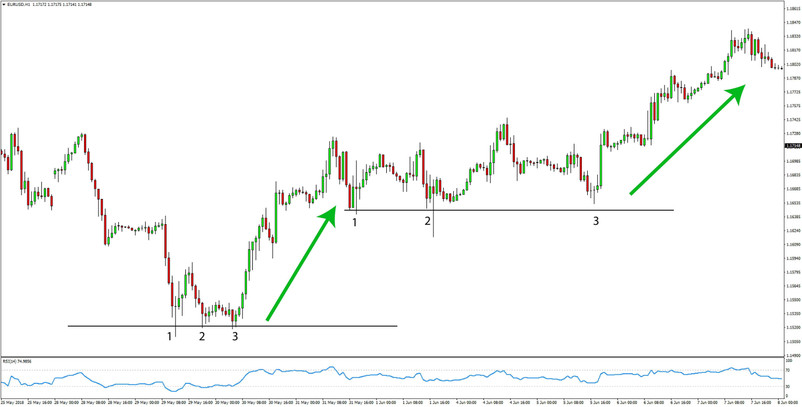
An example where EURUSD started two bullish legs after bottoming twice in a pattern of 3 lows - 1-hour chart
Trading conditions:
Long trade entry:
Wait for two consecutive lows to form on EURUSD and then on the 3rd bounce in the price you can enter long.
Bullish reversals usually form a basing pattern of 1 low then another lower low and then another higher low. This is also a chart pattern that works well on any other asset or currency pair generally but one that is also very specific to EURUSD just because it happens frequently. Sometimes it can also take the shape of an inverted head and shoulders pattern but that is not necessary for it to work.
The lows don’t all have to be at exactly the same level, but only need to be in roughly the same area.
Long trade stop loss:
Place the stop loss order below the lowest low of the 3 lows.
Long trade exit and targets:
Look to target the next resistance higher. Although powerful trends can start after this basing pattern on EURUSD, obviously it’s not always the case. So, taking some profits on the first sign of weakness on the bullish move is still an appropriate way to trade. Most often though, the next solid resistance higher will be reached after this basing pattern.
On the chart below, a bullish example of a long trade is shown:

The powerful bullish price action on the 1st and 3rd low (tall green candles that close near the highs) provide more conviction that the bottom will hold - EURUSD 4-hour chart
Short trade entry:
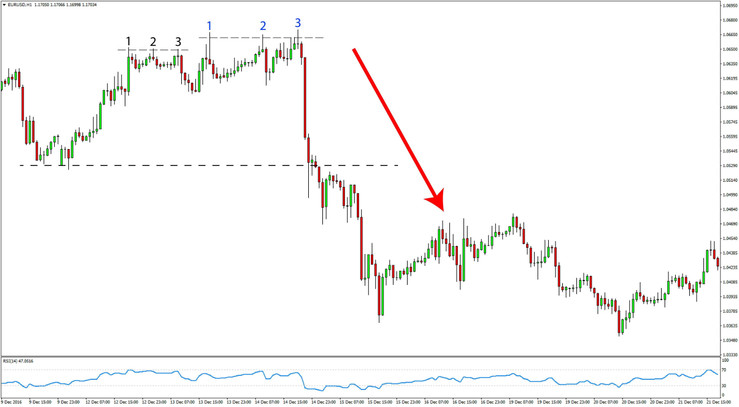
Wait for two consecutive highs to form on EURUSD and then on the 3rd bearish turn in the price you can enter short.
Short trade stop loss:
Put the stop-loss order above the highest high of the 3 highs.
Short trade exit and targets:
Target the next support to the downside. This support needs to be of the same size, meaning if the pattern has appeared on the 1-hour chart, then the target should be also based on the 1-hour chart.
An example of a short trade is shown below:

An example of a bearish leg starting after EURUSD formed 3 distinct highs – EURUSD 1-hour chart
On the above chart, notice how the two pairs of 3 highs (first marked with black numbers and the second in blue) are of the same nature. The first 3 highs are smaller and thus offer lower conviction for a top than the second pair of 3 highs. The second 3 highs (marked in blue) are taller and the shadows are longer. Thus the second pattern is more convincing than the first pair of 3 highs.
Additional guidelines:
- An important aspect to keep in mind is that the 3 highs or 3 lows (depending on whether it is a bearish reversal or bullish reversal) will usually take the same shape. That is, if the first low is rounded and formed by several candles then the next two lows should also take the same shape. They don’t have to look exactly the same but should be similar in nature. If on the other hand, the lows are formed as sharp reversals with only 1 – 2 candles at it, then all 3 lows should be of this nature.
- Keep an eye on the overall trend on the pair. If the trend on larger timeframes is bullish or bearish then the basing or topping pattern will work more accurately than the opposite. For example, if the trend on the daily and weekly is bullish and you see this 3 lows basing pattern on the 1-hour chart then it has a very high probability to provide a profitable trade. However, if you spot the same pattern while the weekly and daily charts are bearish, then the chances of it working will be lower simply because it’s going against the major trend in the market.
- Adding a momentum indicator on the chart such as the RSI helps to read the power behind the price action. Bearish or bullish divergence often helps to pick better entries with this strategy as it confirms that the trend is losing steam and a reversal is near.
- This pattern is also similar and often appears as the head and shoulders pattern. If you see the head and shoulders pattern on EURUSD then that’s potentially a very good trade, especially if the overall setup looks good and is confirmed by other indicators as well.


