The daily timeframe gives an opportunity for longer-term traders to profit from the Forex market. The following strategy is to be used on the daily chart only, on which it can generate great trading opportunities and profits.
Since it is based on a relatively large timeframe, patience will be needed when trading this strategy as not many trades will be generated compared to trading strategies based on smaller timeframes. The advantage is that the strategy is very simple and almost anyone can use it to take trades and profit with it.
It consists of several simple rules which when followed will provide good trades and offer the potential for profit. It’s recommended to use it on the major pairs only because chart patterns work better due to the good liquidity and volume on these currency pairs. The strategy can be enhanced by combining it with other tools and indicators as we shall see later in this article.
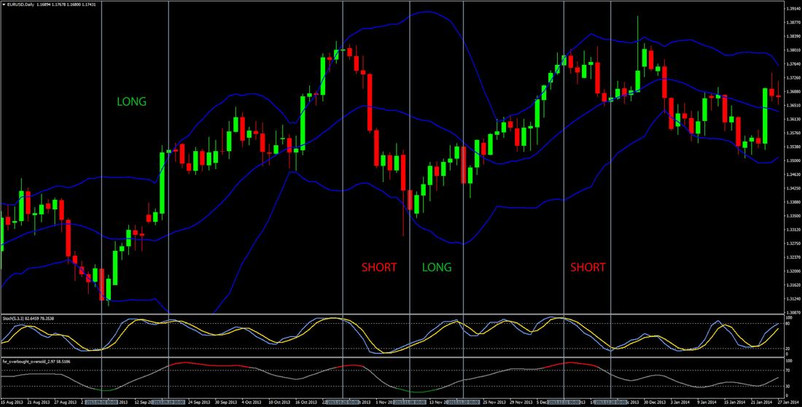
Four trades that were generated by this strategy are shown on the chart below.
The vertical lines indicate the generated trades with this strategy from entry to exit (marked as “LONG” and “SHORT” on the chart) – EURUSD Daily Timeframe
Indicators to be used:
- The FxTR overbought/oversold indicator (Download for free here)
- Bollinger Bands with standard settings (Blue lines on the chart) –Period – 20, Standard Deviation – 2
The Stochastic oscillator can also be used to get an additional perspective on the momentum in the market but is not necessary for this strategy. A “nice” bullish or bearish crossover from inside the oversold or overbought area on the Stochastic can be additional confirmation that a trade setup is a good opportunity to buy or sell.
Trading conditions of the strategy:
Long trade entry:
- Wait for FxTR overbought/oversold indicator to fall in the oversold area and the line to turn green – this is an indication that buying opportunities will probably exist
Long trade stop loss:
- Place the stop below the bullish reversal pattern
Long trade exit and targets:
- 1st target - the middle line of the Bollinger Bands indicator
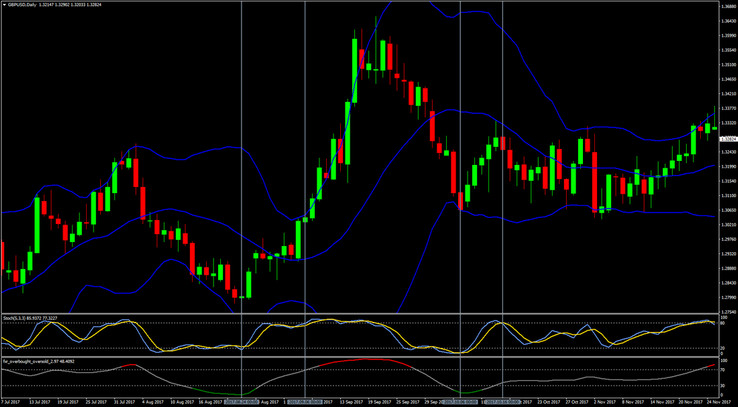
The chart below shows an example of a long trade taken with this Forex strategy

The two sections indicated by the vertical lines on the chart show two buy trades that were generated with this Forex strategy – GBPUSD Daily timeframe
Short trade entry:
- Wait for FxTR overbought/oversold indicator to enter the overbought area and the line to turn red – indicating that we should look for bearish trading opportunities
Short trade stop loss:
- Place the stop above the bearish reversal pattern
Short trade exit:
- 1st target - the middle line of the Bollinger Bands indicator
- 2nd target – the opposite end of the Bollinger Bands indicator (lower line)
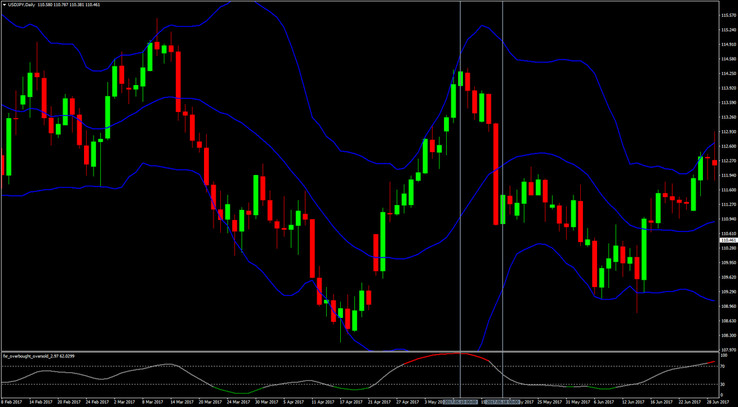
Here’s an example of a short trade:

The section between the two vertical lines show a sell trade generated by this strategy – USDJPY Daily Timeframe
Things to keep in mind when trading with this Forex strategy:
- Since this strategy is based on the daily timeframe it will need relatively larger capital due to the usual size of the stops. This has to be taken into consideration from a risk management perspective.
- During strong trends in the market, the price can take a path of “walking the bands”. This can occur either with the upper or lower Bollinger Band and essentially, the price doesn’t reverse even though it stays at the Bollinger Bands for several trading sessions in a row. Such situations can be the cause for unprofitable trades with this strategy, however, even in such cases of “waling the bands”, the probability that a reversal candlestick pattern will form during a strong trend is very low, so essentially this is the advantage of the strategy. Thus, when a reversal pattern does actually form at one of the Bands, it will likely be followed by at least a few more candles of consolidation if not a full reversal.
- The Bollinger Band is a dynamic indicator, so this is an aspect that must be taken into account. That is, the distance to the profit targets will change with every new bar, so that means that the profit targets should be updated accordingly. Sometimes this may result in trades with very small to near breakeven profit or no profit at all. What is important, however, is that the signals generated with this strategy accurately predict tops and bottoms, so in most cases, the trades will offer nice profits.


