The following strategy can be used on any of the intraday charts however it has shown the best results on the 1-hour timeframe and therefore it’s best to use it on the 1-hour chart. It is most suitable on the major Forex pairs, although there are no limitations regarding the Fx pairs it can be applied on.
This Bollinger Bands - CCI strategy is not a day-trading strategy, meaning trades can be held for as long as the conditions for the trade remain true regardless if that means holding the position overnight.
The main goal of the strategy is to profit on the acceleration of trends and their continuation in the direction of the trend in force.
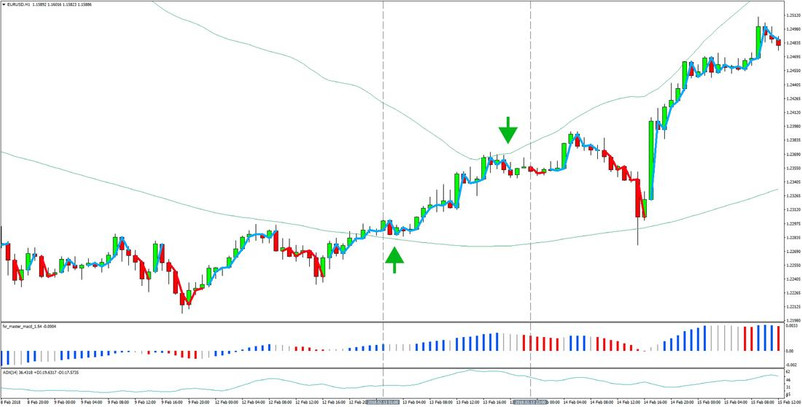
Below is an example of how the strategy looks on the charts:
A long trade as generated by this strategy shown on the EURUSD 1-hour chart
Indicators to be used:
For this strategy, we’ll apply 2 main indicators which are necessary.
- 1st Bollinger Bands with the custom settings as follows: period - 100 and a standard deviation of 3.
- 2nd the FxTR Improved CCI (Download for free here) - developed by the Fx Trading Revolution team – this indicator accurately identifies trends and trend reversals.
Additionally, you can also place the Master MACD and the ADX indicators below the chart to help you determine the momentum of the trend. Weak momentum may be an indication that a potential trading opportunity is not good and the trade will not work out well.
While placing the Master MACD and the ADX are not a requirement for this strategy, they are often helpful as both of those are very useful indicators. Avoiding trades where the ADX is below 25 will result in better trading signals and trades with a higher probability for success.
But, the reason for using these two indicators is only to aid the trader in reading the primary indicators and signals of this strategy which are the crossing of the middle line of the Bollinger Band and the CCI. So, just because the ADX not exactly at 25 doesn’t necessarily mean you should avoid taking the trade altogether if, for example, the other conditions look good.
For illustrating the strategy in this article, we have placed both the ADX and the Master MACD indicators.
The trading conditions for the strategy:
Long trade entry: Long trade stop loss: Long trade profit targets and exit rules:
- Wait for price to cross above the 100 moving average of the Bollinger Band (that is the middle line of the indicator).
- Wait for the CCI indicator to turn blue (bullish).
- Initiate long trade.
- Additionally, it is better if the ADX is above 25 and the Master MACD is showing a bullish trend.
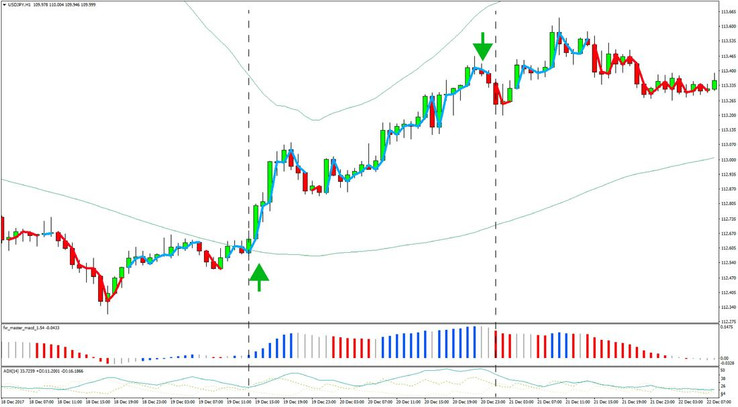
An example of a long trade is shown on the chart below which resulted in a nice profit.

Buy signal indicated with the up arrow on the left and the exit signal shown with the down arrow on the right – USDJPY 1-hour chart
Short entry rule: Short trade Stop Loss: Short trade Profit targets and exit rules:
- Price is below the middle line of the Bollinger Band.
- The CCI indicator is bearish (red).
- Enter a sell position.
- In addition, look for the ADX to be above 25 and the Master MACD to show a bearish trend as verification of the trading signal.
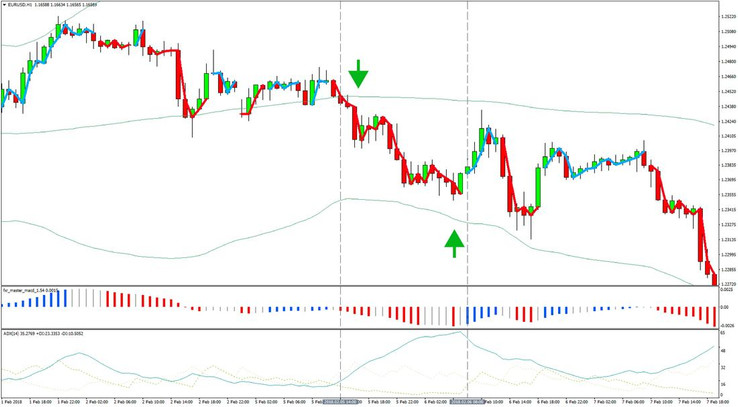
A short trade generated with this strategy is shown on the chart below.

Sell signal (down arrow on the left) and the exit signal (up arrow on the right) – EURUSD 1-hour chart
General guidelines for the strategy
- Aim for at least a 1-1 risk-reward or higher - This goes to managing risk properly. It is very important because many potential trading opportunities may look perfect by the setup but may not fulfill this crucial condition (an acceptable risk for the potential reward). Such trades should not be taken despite the bullish signals and the good-looking trade setup.
- There is no need to exit when the CCI turns neutral as this can only be noise and then the indicator can just turn bullish again. The ADX and the Master MACD can, however, confirm that a change to neutral in the CCI is something more important and that a possible reversal is coming.
- Avoid closing a trade on small fluctuations of the CCI if sufficient profit has not been achieved yet – This is where the ADX, the Master MACD and just reading the price action can help you in staying with a trade during sideways price action.
- Obviously, paying attention to support and resistance on larger timeframes will be important when using this strategy as is in most cases when trading Forex. A strong resistance or support on the way to the profit target is a serious obstacle for achieving the target and, therefore, it’s better to avoid taking such trades.


