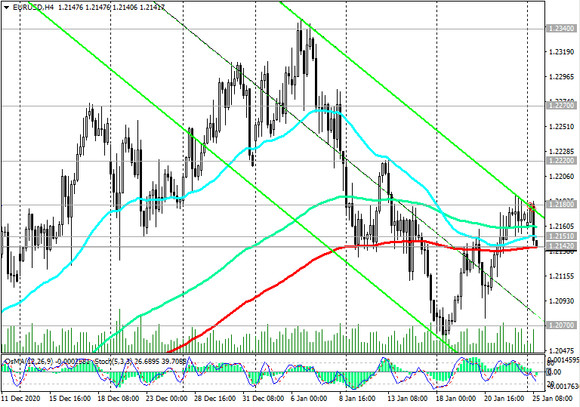
At the beginning of today's European session, EUR / USD is traded near the 1.2151 mark, through which the short-term support level in the form of EMA200 on the 1-hour chart passes. Another strong short-term support level 1.2142 (ЕМА200 on 4-hour chart) is located just below.

From a technical point of view, these are key short-term, but important levels. Their breakdown could cause the start of a further decline in EUR / USD, which for now should be considered as corrective and provides a good opportunity to build up long positions.

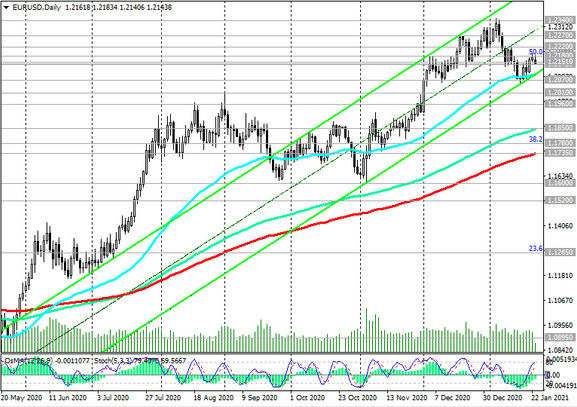
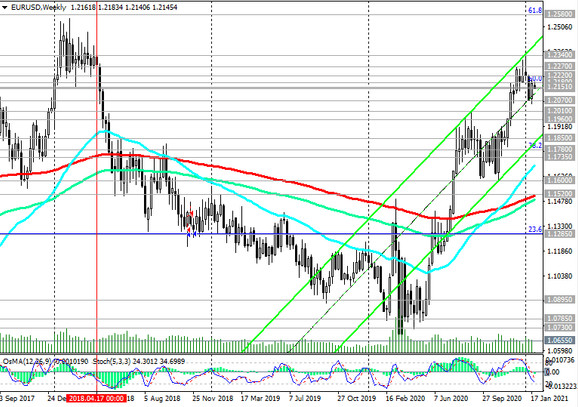
However, one way or another, the long-term positive dynamics of EUR / USD remains on the background of fundamental factors. The breakdown of the resistance level 1.2180 (Fibonacci level 50% of the upward correction in the wave of the pair's decline from the level of 1.3870, which began in May 2014) will confirm the tendency of EUR / USD to further rise within the upward channels on the daily and weekly charts. After exceeding the local 32-month maximum near the mark of 1.2340, the targets will be the resistance levels 1.2500, 1.2580 (Fibonacci level 61.8%), 1.2600.

In an alternative scenario and below the local support level 1.2070, short positions will be preferred. If the downward dynamics develops, EUR / USD may decline to the long-term support levels 1.1850 (EMA144 on the daily chart), 1.1780 (Fibonacci level 38.2%), 1.1735 (EMA200 on the daily chart).
A breakdown of the support level 1.1285 (Fibonacci level 23.6%) will finally return EUR / USD to a long-term downtrend.
Support Levels: 1.2151, 1.2142, 1.2070, 1.2010, 1.1960, 1.1850, 1.1780, 1.1735, 1.1600, 1.1520, 1.1285
Resistance Levels: 1.2180, 1.2220, 1.2270, 1.2340, 1.2555, 1.2580, 1.2600
Trading Recommendations
Sell Stop 1.2135. Stop-Loss 1.2190. Take-Profit 1.2100, 1.2070, 1.2010, 1.1960, 1.1850, 1.1780, 1.1735, 1.1600, 1.1520, 1.1285
Buy Stop 1.2210. Stop-Loss 1.2135. Take-Profit 1.2270, 1.2340, 1.2555, 1.2580, 1.2600


