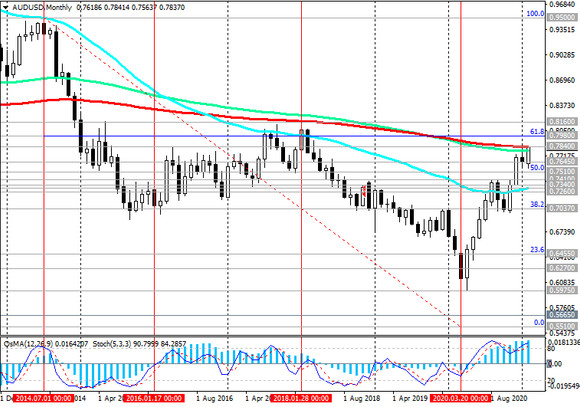
As we noted earlier, at the beginning of today's European session, the AUD / USD pair is traded near 0.7840 mark, corresponding to new 3-year highs.
In the zone above the key support levels 0.7410 (ЕМА144 on the daily chart), 0.7300 (ЕМА200 on the daily chart), 0.7260 (ЕМА200 on the weekly chart), the long-term positive dynamics of AUD / USD remains.
However, it is worth noting that AUD / USD has come up against a strong long-term resistance level 0.7840 (ЕМА200 on the monthly chart), which separates the long-term bullish trend of the pair from the bearish one.
It is most likely that AUD / USD will stabilize in the vicinity of this level and 0.7840 mark before heading to new highs.
A breakout of this resistance level will be a signal for the resumption of growth in AUD / USD towards the resistance levels of 0.7980 (Fibonacci level 61.8% of the correction to the wave of the pair's decline from the level 0.9500 in July 2014 to the lows of 2020 near the 0.5510 mark), 0.8160.
In an alternative scenario, a signal for selling AUD / USD will be a breakout of important short-term support levels 0.7691 (ЕМА200 on a 4-hour chart), 0.7748 (ЕМА200 on a 1-hour chart).
The breakdown of the support level 0.7645 (ЕМА50 on the daily chart) will increase the risks of further decline towards the support levels 0.7410, 0.7300, 0.7260.
In the current situation and above the support level 0.7748, long positions remain preferable, and a confirmed breakdown of the resistance level 0.7840 will become a signal to build up long positions.
Support levels: 0.7748, 0.7691, 0.7645, 0.7510, 0.7410, 0.7340, 0.7300, 0.7260, 0.7200, 0.7100, 0.7037
Resistance levels: 0.7840, 0.7980, 0.8160
Trading Recommendations
Sell Stop 0.7730. Stop-Loss 0.7850. Take-Profit 0.7691, 0.7645, 0.7510, 0.7410, 0.7340, 0.7300, 0.7260, 0.7200, 0.7100, 0.7037
Buy Stop 0.7850. Stop-Loss 0.7730. Take-Profit 0.7900, 0.7980, 0.8160


