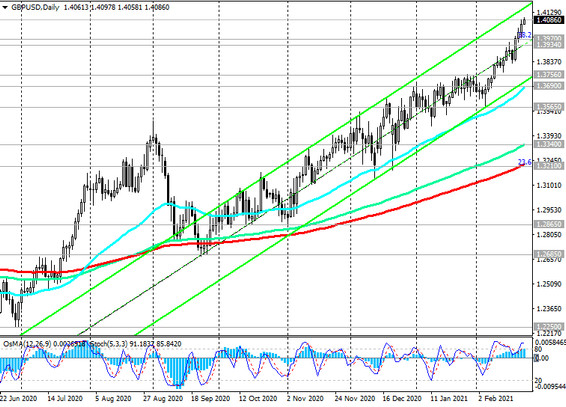
As of this writing, the GBP / USD pair is traded near the 1.4088 mark, slightly lowering from a fresh 35-month high of 1.4098.
GBP / USD continues to trade within the upward channels on the daily and weekly charts, generally maintaining long-term positive dynamics and staying in the zone above the important short-term 1.3756 (ЕМА200 on the 4-hour chart), 1.3934 (ЕМА200 on the 1-hour chart) and long-term 1.3210 (ЕМА200 on the daily and weekly charts) support levels in the territory of the bull market.
After the breakdown of the local resistance level 1.4100, the growth of GBP / USD will continue towards the resistance levels 1.4350, 1.4440, 1.4830 (Fibonacci level 50% of the correction to the decline in the GBP / USD pair in the wave that began in July 2014 near the level of 1.7200), 1.4830 (ЕМА200 on the monthly graph).
In an alternative scenario and after the breakdown of the support levels 1.3934, 1.3756 GBP / USD may fall to the support levels 1.3690 (ЕМА50 on the daily chart), 1.3565, and after their breakdown - to the support levels 1.3300, 1.3210.
However, only a breakdown of the local support level 1.2685 (September lows) will increase the risks of a resumption of the global bearish trend in GBP / USD and may provoke a deeper decline towards support levels 1.2250, 1.2085, 1.2000 (Fibonacci level 0%).
Support levels: 1.3970, 1.3934, 1.3756, 1.3690, 1.3565, 1.3340, 1.3210
Resistance levels: 1.4100, 1.4350, 1.4440, 1.4580
Trading recommendations
Sell Stop 1.4040. Stop-Loss 1.4110. Take-Profit 1.4000, 1.3970, 1.3934, 1.3756, 1.3690, 1.3565, 1.3340, 1.3210
Buy Stop 1.4110. Stop-Loss 1.4040. Take-Profit 1.4200, 1.4350, 1.4440, 1.4580