Against the backdrop of optimism by investors and participants in the oil market associated with expectations of a further recovery in the global economy, the price of Brent crude oil has been growing since May last year. At its end, the price reached a 9-month high near $ 52.49 per barrel. At the beginning of the new 2021, the price growth continued. The price remains positive dynamics.
On Friday, Brent crude is traded in the middle of the upward channel on the daily chart, in the zone above the key support levels 55.50 (ЕМА200 on the weekly chart), 51.70 (ЕМА200 on the daily chart), as well as above important short-term support levels 63.43 (ЕМА200 on the 4-hour chart), 67.72 (ЕМА200 on the 1-hour chart).
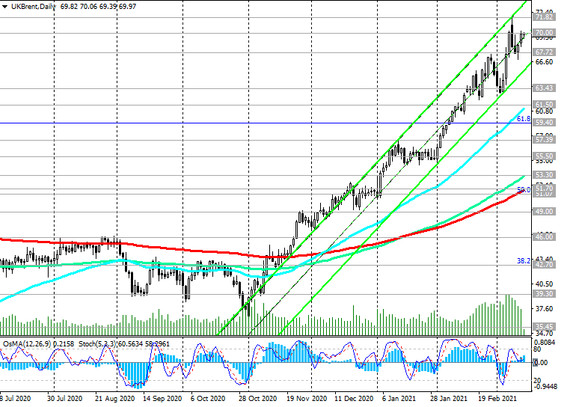
In case of maintaining positive dynamics and after the breakdown of the nearest resistance level 71.80 (local highs), the price will continue to grow towards resistance levels 75.50 (April 2019 high), 86.60 (multi-year highs and 100% Fibonacci level, when the price collapse began in October 2018, to practically absolute minimums at 15.55 in April 2020).
An alternative scenario will be associated with the breakdown of the support levels 67.72, 63.43 and a decline to the support level 55.50. A breakdown of the 51.70 support level will strengthen the negative dynamics and the likelihood of a return into the downtrend.
Support levels: 67.72, 63.43, 61.50, 59.40, 57.39, 55.50, 53.30, 51.70, 51.07, 49.00, 47.20, 46.00, 42.70, 39.30, 35.45, 32.20
Resistance levels: 70.00, 71.82, 75.50, 86.60
Trading recommendations
Sell Stop 69.30. Stop-Loss 70.30. Take-Profit 67.72, 63.43, 61.50, 59.40, 57.39, 55.50, 53.30, 51.70
Buy Stop 70.30. Stop-Loss 69.30. Take-Profit 71.82, 75.50, 86.60