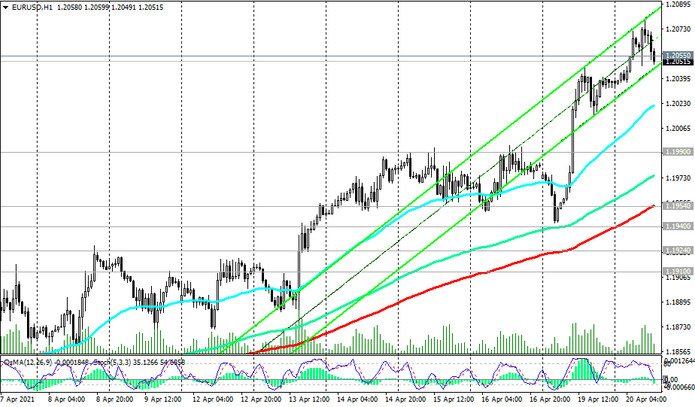
EUR / USD maintains positive dynamics, trading near the 1.2050 mark at the time of this article's publication, testing for the breakout of the long-term and key resistance level 1.2055 (ЕМА200 on the monthly chart) separating the EUR / USD bullish trend from the bearish one.
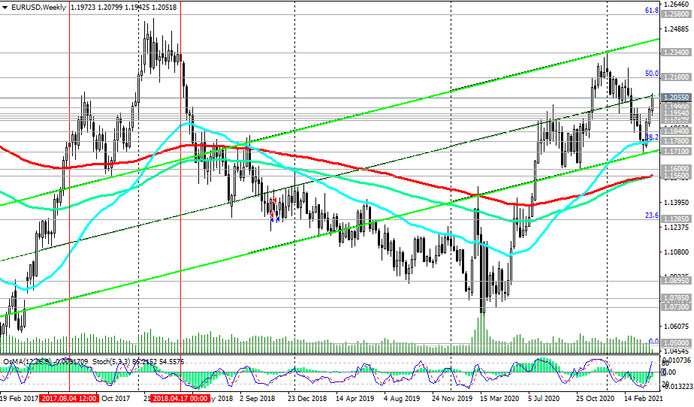
In case of a confirmed breakdown of the resistance level 1.2055, the EUR / USD will continue to grow towards the resistance levels 1.2180 (Fibonacci level 50% of the upward correction in the wave of the pair's decline from the 1.3870 mark, which began in May 2014), 1.2340 (this year's highs).
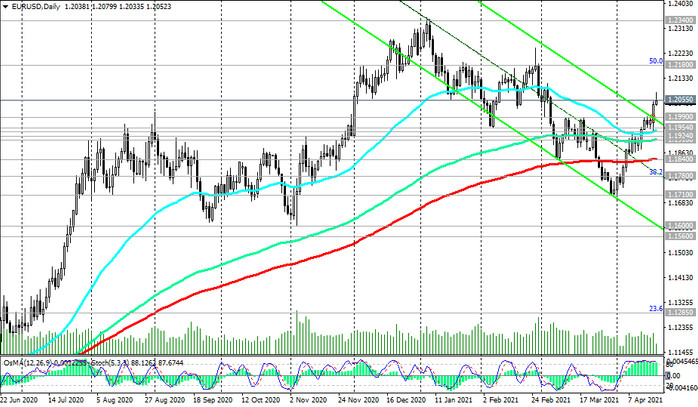
In an alternative scenario and after the breakdown of the support level 1.1990 (the upper border of the descending channel on the daily chart), EUR / USD will resume its decline deep into this channel.
The first signal for the implementation of this scenario will be a breakdown of the short-term support level 1.2020 (ЕМА200 on the 15-minute chart).
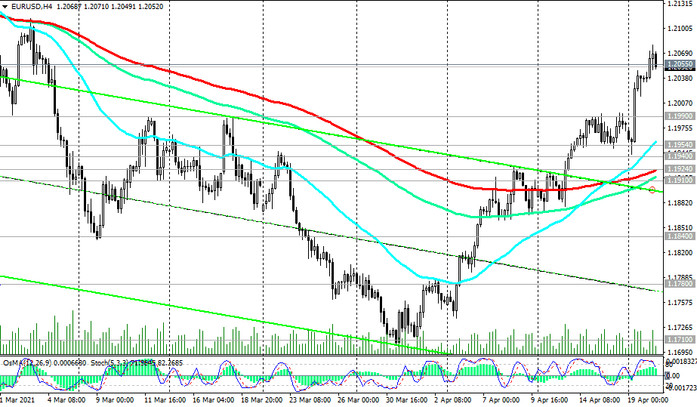
Breakout of important short-term support levels 1.1954 (ЕМА200 on the 1-hour chart), 1.1924 (ЕМА200 on the 4-hour chart) will confirm the scenario of EUR / USD decline with the nearest target at the key support level 1.1840 (ЕМА200 on the daily chart).
The breakout of the support levels 1.1780 (Fibonacci level 38.2%), 1.1710 (local lows) will resume the downward dynamics of EUR / USD and direct it towards the support level 1.1560 (ЕМА200 and ЕМА144 on the weekly chart). Its breakdown will increase the risks of a resumption of the long-term bearish trend in EUR / USD.
Support levels: 1.2020, 1.1990, 1.1954, 1.1940, 1.1924, 1.1910, 1.1840, 1.1780, 1.1710, 1.1600, 1.1560
Resistance levels: 1.2055, 1.2100, 1.2180, 1.2270, 1.2340, 1.2555, 1.2580, 1.2600
Trading Recommendations
Sell Stop 1.2015. Stop-Loss 1.2085. Take-Profit 1.1990, 1.1954, 1.1940, 1.1924, 1.1910, 1.1840, 1.1780, 1.1710, 1.1600, 1.1560
Buy Stop 1.2085. Stop-Loss 1.2015. Take-Profit 1.2100, 1.2180, 1.2270, 1.2340, 1.2555, 1.2580, 1.2600

