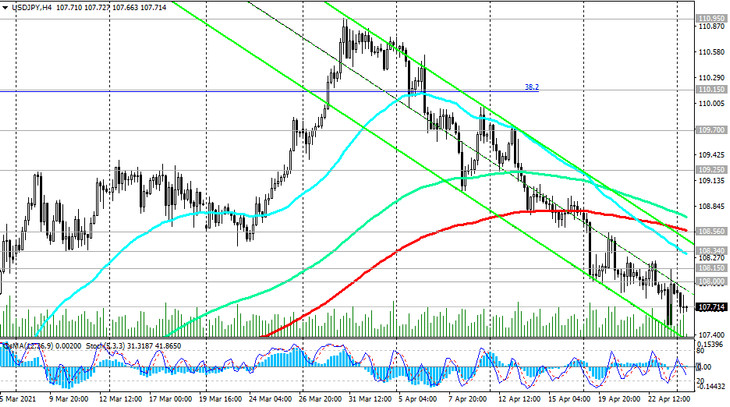
Since the beginning of this month, the USD / JPY pair has been actively declining, mainly due to the weakening of the dollar. At the start of today's European session, it is traded near 107.70 mark, below the important short-term resistance levels 108.34 (EMA200 on the 1-hour chart), 108.56 (EMA200 on the 4-hour chart), below which short positions are preferred.
It is also worth noting that USD/JPY broke through the important support level 108.00 on the eve (the lower limit of the ascending channel on the daily chart and EMA200 on the weekly chart), and the OsMA and Stochastic indicators on the weekly chart went over to the sellers' side.
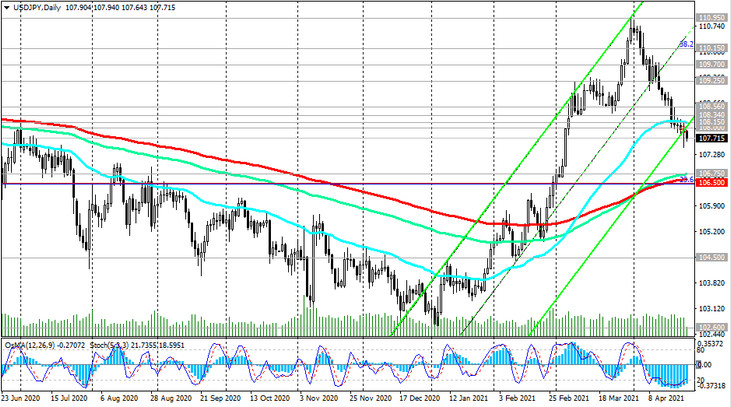
If the decline in USD / JPY continues, then the pair will go to the area of key support levels 106.75 (ЕМА50 on the weekly chart and ЕМА144 on the daily chart), 106.50 (ЕМА200 on the daily chart and 23.6% Fibonacci level of the correction of the pair's fall from 125.65, which began at June 2015).
A breakdown of the 106.00 support level will trigger an intensification of the downward momentum and direct USD / JPY towards more distant decline targets at 104.70 (2018 lows), 102.30, 101.20 (2020 lows).
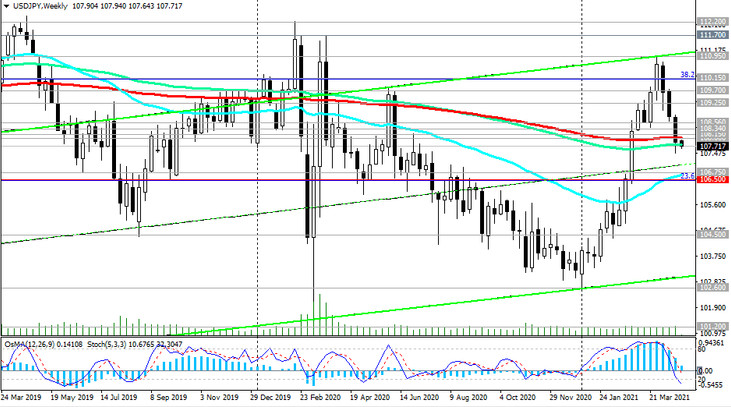
In an alternative scenario, after a return to the bull market zone above the resistance level 108.15 (ЕМА50 on the daily chart) and after the breakdown of the resistance levels 108.34, 108.56, long positions will again become relevant.
And so far, the meantime, short positions are preferred.
Support levels: 107.00, 106.75, 106.50, 106.00
Resistance levels: 108.00, 108.15, 108.34, 108.56
Trading scenarios
Buy Stop 108.40. Stop Loss 107.40. Take-Profit 109.00, 109.25, 109.70, 110.95
Sell by market, Sell Stop 107.40. Stop Loss 108.40. Take-Profit 107.00, 106.75, 106.50, 106.00, 104.50, 102.60, 101.20, 100.60, 100.00

