At the beginning of today's American session, the USD / CAD pair is traded near the level 1.2160, still maintaining a tendency to further decline, including against the backdrop of strong fundamental factors.

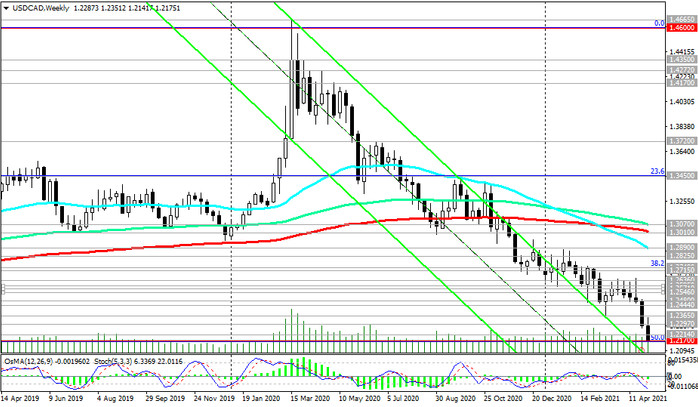
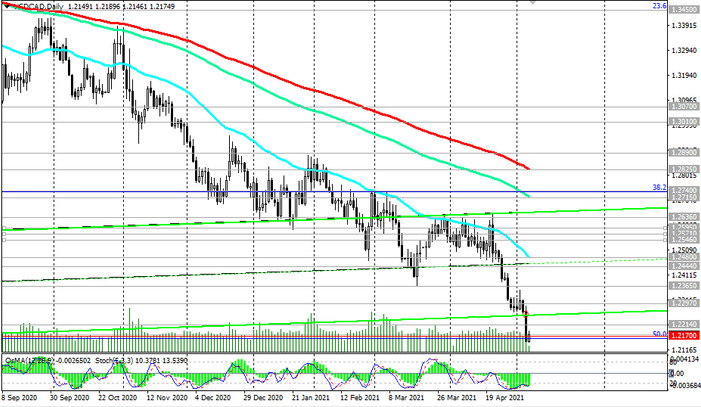
The pair is traded below the important long-term resistance levels 1.2450 (ЕМА200 on the monthly chart), 1.3010 (ЕМА200 on the weekly chart), 1.2825 (ЕМА200 on the daily chart).
Remaining below the key resistance levels 1.2450, 1.2825, in fact, USD / CAD is in the bear market zone.

A breakdown of the support level 1.2160 (Fibonacci level 50% of the downward correction in the wave of USD / CAD growth from 0.9700 to 1.4600) will finally return USD / CAD into a long-term bearish trend. So far, everything is shaping up in favor of short positions and further decline.

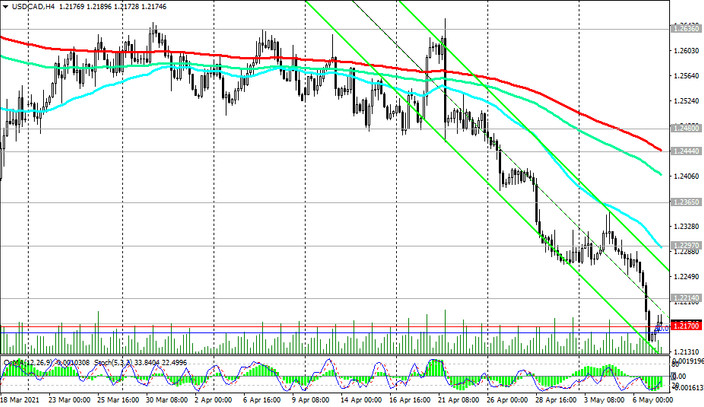
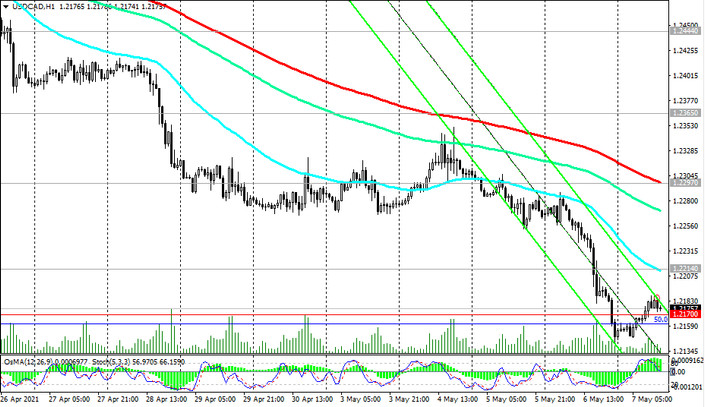
In an alternative scenario, the first signal for a possible start of a reversal and breaking of the bearish trend will be a breakdown of the short-term resistance level 1.2214 (ЕМА200 on the 15-minute chart). The breakdown of the important short-term resistance levels 1.2440 (ЕМА200 on the 4-hour chart), 1.2297 (ЕМА200 on the 1-hour chart) will confirm an alternative scenario with the prospect of growth towards resistance levels 1.2480, 1.2825.

Support levels: 1.2160, 1.2100
Resistance levels: 1.2214, 1.2297, 1.2365, 1.2440, 1.2480, 1.2636, 1.2715, 1.2740, 1.2825
Trading scenarios
Sell Stop 1.2140. Stop-Loss 1.2220. Take-Profit 1.2100, 1.2000
Buy Stop 1.2220. Stop-Loss 1.2140. Take-Profit 1.2297, 1.2365, 1.2440, 1.2480, 1.2636, 1.2715, 1.2740, 1.2825


