The dollar and the USD / JPY pair were unable to develop positive dynamics on the strong momentum received last Wednesday, when the better-than-expected US consumer inflation indexes were published.
On Thursday, the USD / JPY pair reached a local 5-day high near 109.78, but then declined, and on Friday its decline continues in the first half of today's trading day.
At the time of this article publication, it is traded near 109.35 mark, in the zone below the short-term resistance level 109.40 (ЕМА200 on the 15-minute chart).
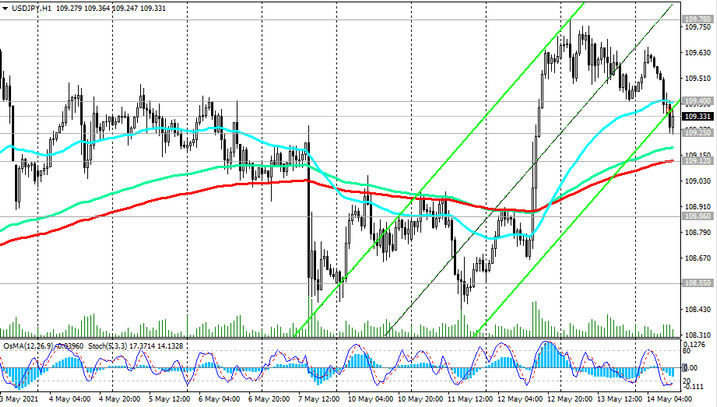
In case of further weakening of the USD and a breakdown of the local support level 109.25 USD / JPY will head towards the important short-term support level 109.12 (ЕМА200 on the 1-hour chart).
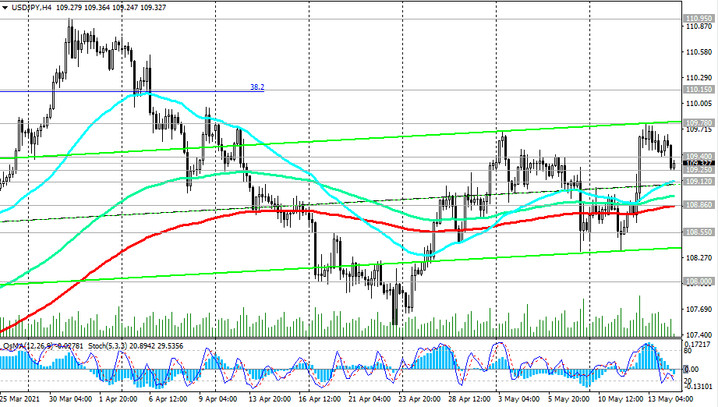
The breakout of this support level will provoke a deeper decline towards the support levels 108.86 (ЕМА200 on the 4-hour chart), 108.55 (ЕМА50 on the daily chart), 108.00 (ЕМА200 on the weekly chart).
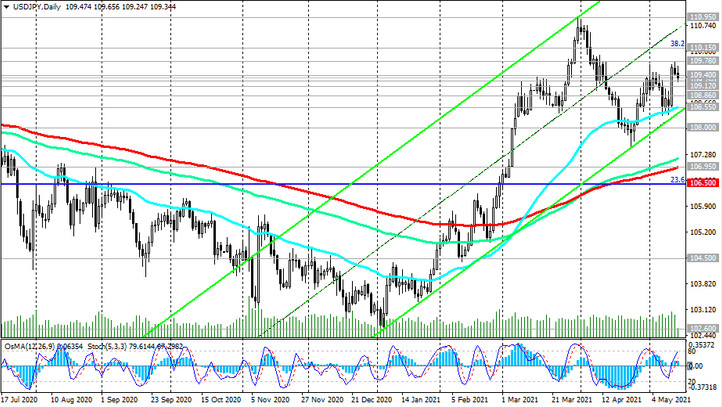
The breakdown of the support levels 106.95 (ЕМА200 on the daily chart), 106.50 (ЕМА200 on the daily chart and the Fibonacci level 23.6% of the correction of the pair's fall from the level of 125.65, which began in June 2015) will cause an increase in the downward momentum and direct USD / JPY towards more distant targets 104.70 (2018 lows), 102.30, 101.20 (2020 lows).
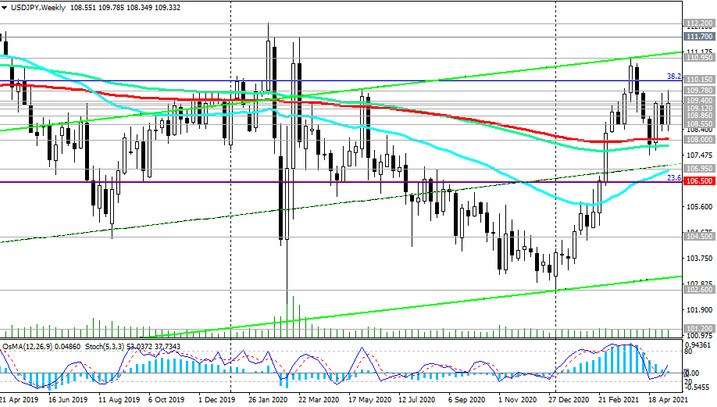
In an alternative scenario, and after the breakdown of the local resistance level 109.78, USD / JPY will head towards the resistance levels 110.15 (Fibonacci level 38.2%), 110.95, 111.70 (local highs).
In the meantime, short positions are preferred below the resistance level 109.40.
Support levels: 109.25, 109.12, 108.86, 108.55, 108.00, 107.00, 106.75, 106.50, 106.00
Resistance levels: 109.40, 109.78, 110.15, 110.95, 111.70
Trading scenarios
Buy Stop 109.70. Stop Loss 109.20. Take-Profit 110.15, 110.95, 111.70
Sell by market, Sell Stop 109.20. Stop Loss 109.70. Take-Profit 109.12, 108.86, 108.55, 108.00, 107.00, 106.75, 106.50, 106.00

