This week was negative for the oil market. As a result of the 3-day decline the day before, oil prices fell to the levels of 4 weeks ago. On the monthly chart, the prices of both major brands of oil WTI and Brent have formed a black candlestick, which may be a harbinger of a deeper correction in the oil market.
Oil prices are rising today after the recent strong drop. However, it looks like they will decline by the end of this week.
Oil futures fell sharply, in part due to media reports of progress in negotiations on Iran's nuclear program. Negotiations between Iran and the world's leading powers are ongoing, and they are aimed at restoring the international deal from 2015 on the atomic program of the Islamic republic. If successful in the negotiations, the United States can lift sanctions against Iran, which will allow it to increase oil exports. The lifting of sanctions on Iran could further worsen the market sentiment.
Data released on Wednesday by the Energy Information Administration (EIA) of the US Department of Energy indicated an increase in oil reserves in the United States, albeit less significant than expected (+1.321 million barrels against the forecast of +1.623 million barrels and a decrease of -0.427 million barrels a week earlier), which also is a negative factor for prices.
At the same time, favorable supply and demand fundamentals and an optimistic mood in the stock market mean that the decline in prices may be short-lived, and after the completion of the correction, they may be followed by a new increase.
World stocks and spare production capacity are shrinking, and investors with a high risk appetite are likely to bet on higher oil prices.
Meanwhile, the Biden administration has decided to dramatically increase supplies of the Covid-19 vaccine to other countries. The United States now plans to ship 20 million doses of vaccines Moderna Inc., Pfizer Inc. and Johnson & Johnson, which are used in the United States, to other countries.
The trend towards a further weakening of the dollar and hopes for the recovery of the European and American economies, where the gradual lifting of quarantine restrictions continues, also support the optimism of investors who are betting on further growth in oil prices.
Thus, at the moment, strong multidirectional factors have formed on the oil market, which may continue to rock the oil market in the short term, increasing volatility.
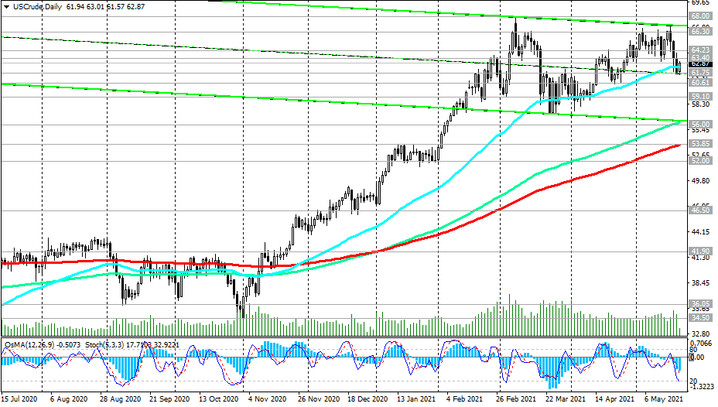
In general, despite the decline this week, oil prices are in the zone of a long-term bull market, which began its countdown from the beginning of May 2020 after a sharp drop in the period from January to April 2020 amid the outbreak of the coronavirus pandemic. At the moment, oil prices have returned to the levels of 2 years ago, and the trend for their further growth is still preserved.
Today, investors and participants in the oil market will await the publication of the weekly report of the American oilfield services company Baker Hughes (at 17:00 GMT). The week before last, the number of active drilling rigs in the United States amounted to 352 units (against 344, 342, 343, 337, 324, 318, 309, 310, 309, 305 in the previous reporting periods). It is obvious that the number of oil companies in the US is growing again, which is a negative factor for oil prices. Their next growth will also have a negative impact on oil quotes. However, it will be short-lived. In general, at the moment, long positions in oil seem to be more preferable.
During today's Asian session, oil futures traded in a narrow range, and with the beginning of the European session began to rise again. It is possible that the correctional decline has already been completed. Growth to the zone above the resistance level of 63.40 will become a confirming signal for the resumption of purchases in futures for WTI crude oil (see Technical analysis and trading recommendations).