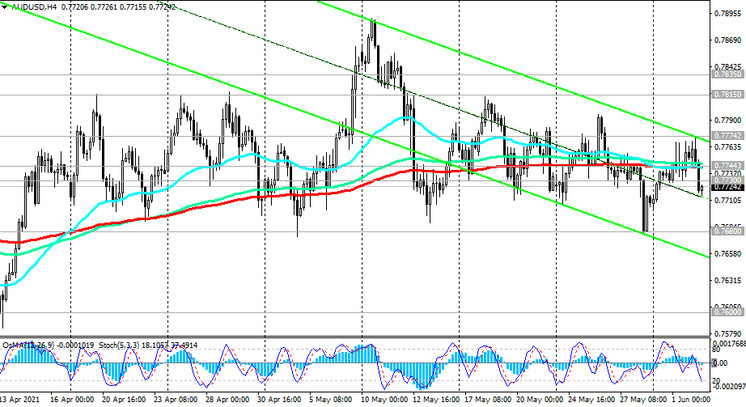
As we noted above, since the beginning of the year, the AUD / USD pair continues to trade in a range, mainly between the levels of 0.7600 and 0.7835. In the last 3 weeks, this range has narrowed to 0.7680 and 0.7815 levels.
It is obvious that the pair lacks new strong drivers to move in one direction or another, and much in this matter will depend on the position of the central banks of Australia and the United States.
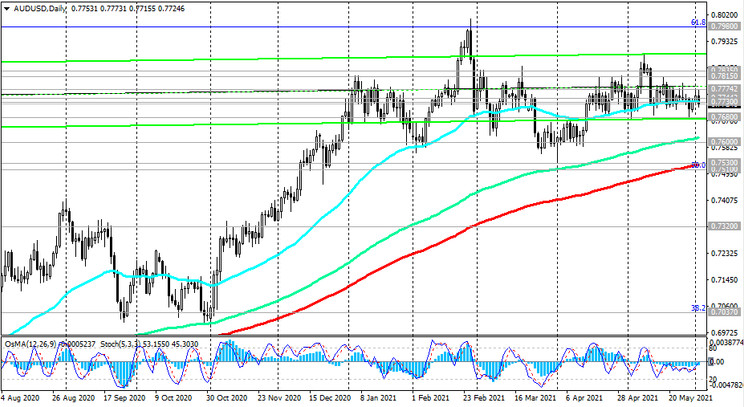
From a technical point of view, the breakout of the important short-term support levels of 0.7744 (ЕМА200 on the 1-hour and 4-hour charts), 0.7730 (ЕМА50 on the daily chart) creates the preconditions for further decline.
A breakdown of the support level of 0.7680 (local minimums) will strengthen the negative dynamics of AUD / USD and direct it towards the key support levels 0.7615 (ЕМА144 on the daily chart), 0.7530 (ЕМА200 on the daily chart), 0.7510 (Fibonacci level 50% of the correction to the wave of decline in the pair with the level of 0.9500 in July 2014 to the lows of 2020 near the mark of 0.5510).
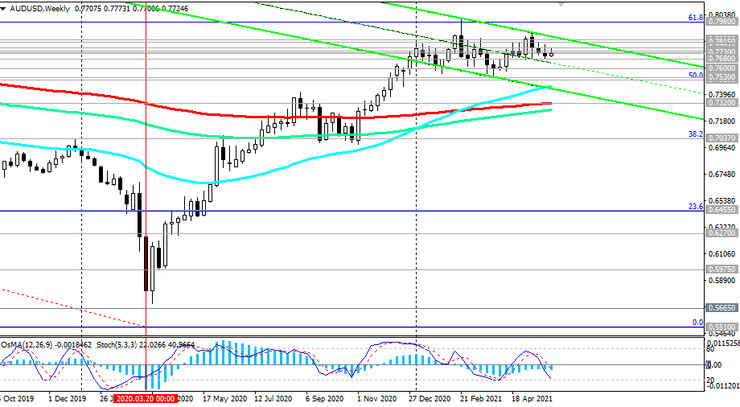
A breakdown of the support level 0.7320 (ЕМА200 on the weekly chart) will finally return AUD / USD into a long-term downtrend.
In an alternative scenario and while maintaining the current range tendency, the decline in AUD / USD will stop at the current levels. However, to resume buying, you should still wait for the AUD / USD to return into the zone above the resistance level 0.7744.
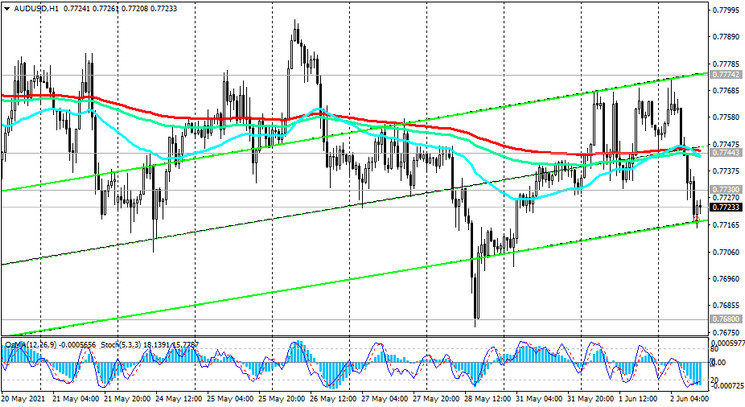
The breakdown of the resistance levels 0.7815, 0.7835 (ЕМА200 on the monthly chart) will become a confirming signal for the resumption of long positions with a distant target at 0.8100, 0.8160, 0.8200.
Support levels: 0.7680, 0.7615, 0.7600, 0.7530, 0.7510, 0.7320
Resistance levels: 0.7730, 0.7744, 0.7774, 0.7815, 0.7835, 0.7980, 0.8000, 0.8160, 0.8200
Trading Recommendations
Sell Stop 0.7690. Stop-Loss 0.7780. Take-Profit 0.7615, 0.7600, 0.7530, 0.7510, 0.7320
Buy by market, Buy Stop 0.7750. Stop-Loss 0.7690. Take-Profit 0.7744, 0.7774, 0.7815, 0.7835, 0.7980, 0.8000, 0.8160, 0.8200

