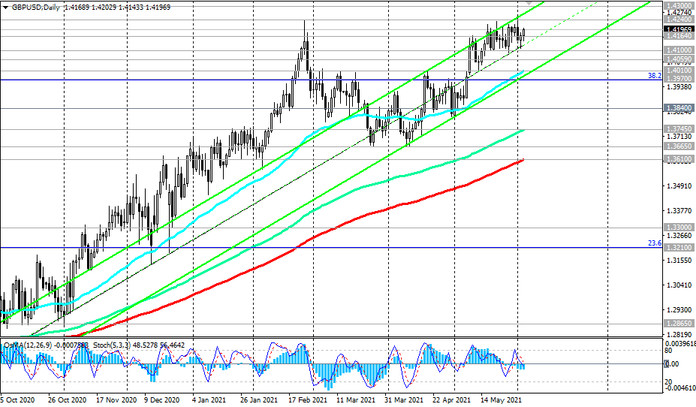
GBP / USD maintains positive long-term dynamics, moving within the upward channels on the daily and weekly charts. Their upper border goes through the marks 1.4240 and 1.4830, respectively.
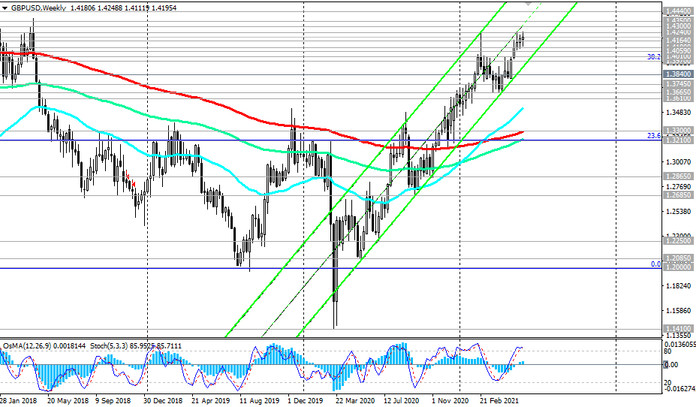
After the breakdown of the local resistance level and the upper border of the ascending channel on the daily chart 1.4240, the resistance level 1.4830 (ЕМА200 on the monthly chart and the upper border of the ascending channel on the weekly chart) will become the target of GBP / USD growth in the coming months. Intermediate growth targets for the pair are resistance levels 1.4580 (Fibonacci level 50% of the correction to the decline of the GBP / USD in the wave that began in July 2014 near the mark of 1.7200), 1.4800.
At the time of this article publication, GBP / USD is traded near 1.4195 mark, in the zone above the support levels 1.4164 (ЕМА200 on the 1-hour chart), 1.4100 (ЕМА144 on the 4-hour chart), 1.4059 (ЕМА200 on the 4-hour chart), maintaining the bias to further growth amid fundamental factors.
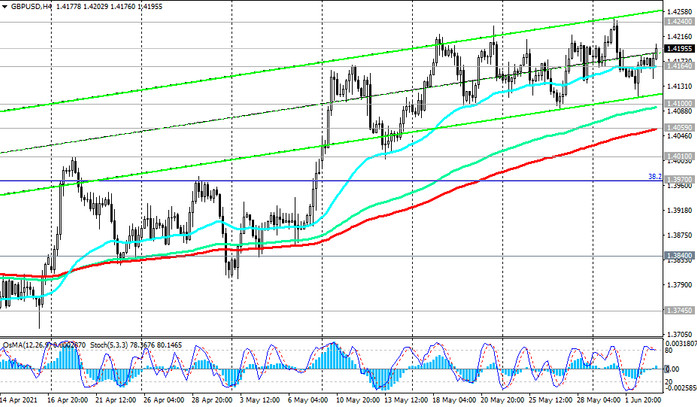
In an alternative scenario, and after the breakdown of the support level 1.4059, GBP / USD may decline to support levels 1.4010 (ЕМА50 and the lower line of the ascending channel on the daily chart), 1.3970 (Fibonacci level 38.2%), and after their breakdown - to levels 1.3745 (ЕМА144 on the daily chart), 1.3610 (ЕМА200 on the daily chart).
The breakout of support levels 1.3300 (ЕМА200 on the weekly chart), 1.3210 (Fibonacci level 23.6%) will increase the risks of a resumption of the global bearish trend in GBP / USD and may provoke a deeper decline towards support levels 1.2250, 1.2085, 1.2000 (Fibonacci level 0%).
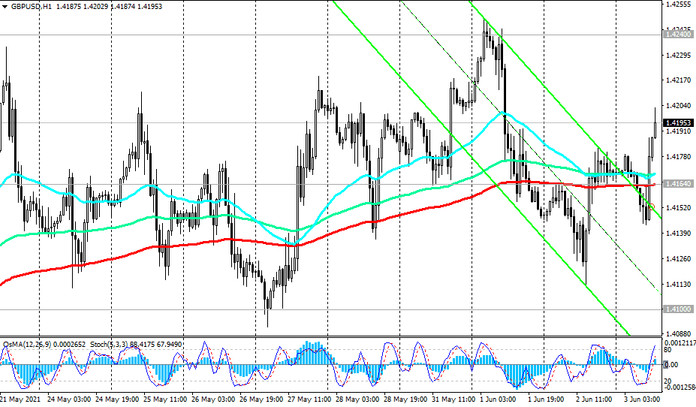
A breakdown of the short-term support level 1.4164 (ЕМА200 on the 1-hour chart) may become the first signal for the implementation of the alternative scenario.
Support levels: 1.4164, 1.4100, 1.4059, 1.4010, 1.3970, 1.3900, 1.3840, 1.3745, 1.3665, 1.3610
Resistance levels: 1.4240, 1.4300, 1.4350, 1.4440, 1.4580, 1.4830
Trading recommendations
Sell Stop 1.4160. Stop-Loss 1.4210. Take-Profit 1.4100, 1.4059, 1.4010, 1.3970, 1.3900, 1.3840, 1.3745, 1.3665, 1.3610
Buy Stop 1.4210. Stop-Loss 1.4160. Take-Profit 1.4240, 1.4300, 1.4350, 1.4440, 1.4580, 1.4830