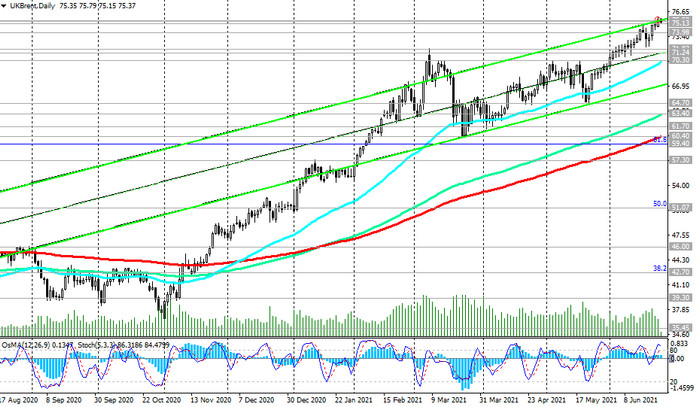
The price of Brent crude oil maintains positive dynamics, moving in upward channels on the daily and weekly charts.
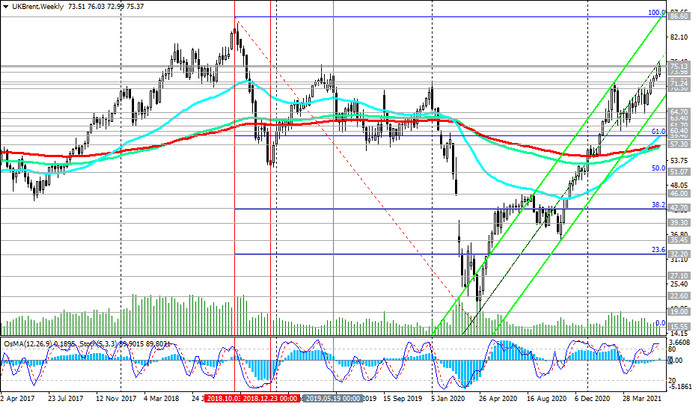
The price remains in the bull market zone, above the long-term support levels 57.30 (EMA200 on the weekly chart), 59.40 (Fibonacci level 61.8%), 60.40 (EMA200 on the daily chart) and short-term levels 73.98 (EMA200 on the 1-hour chart) and 71.24 (ЕМА200 on the 4-hour chart).
The breakdown of the local resistance level 76.00 will cause a further rise in the price towards the local resistance levels 80.00, 81.00 and the upper border of the ascending channel on the weekly chart passing through the 86.60 mark (October 2018 highs and 100% Fibonacci retracement level before the start of the collapse in price).
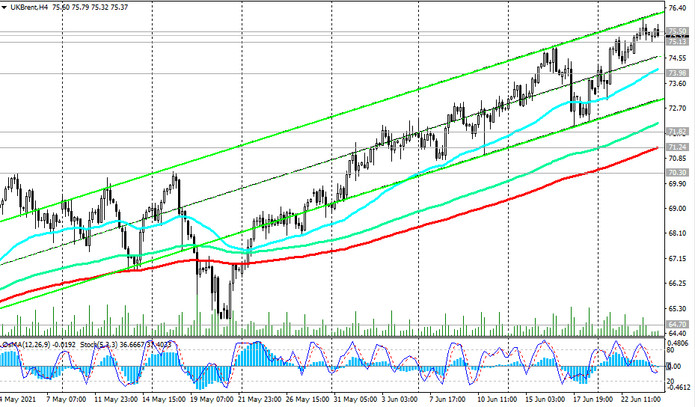
In an alternative scenario and in case of a breakdown of the support level 70.30 (ЕМА50 on the daily chart), the decline may continue to the levels 60.40, 59.40, 57.30.
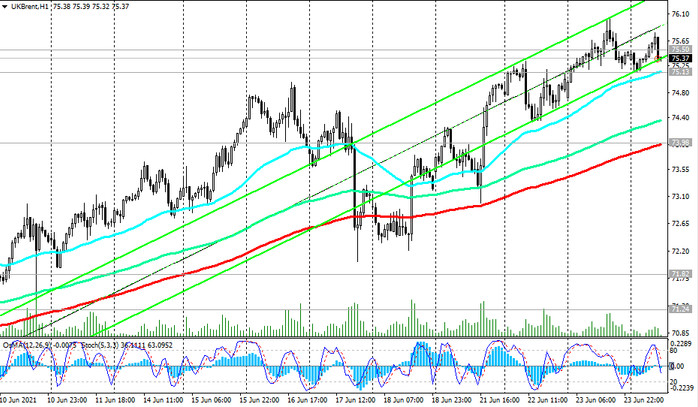
A breakdown of the support level 57.30 will strengthen the negative dynamics and the likelihood of a return into the downtrend. The first signal for the implementation of this scenario will be a breakdown of short-term support levels 75.13 (ЕМА200 on a 15-minute chart), 73.98.
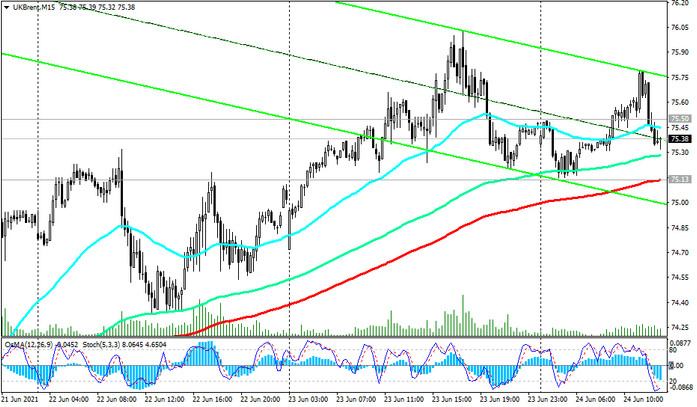
Support levels: 75.13, 73.98, 71.82, 71.24, 70.30, 64.70, 63.40, 61.70, 60.40, 59.40, 57.30
Resistance levels: 76.00, 80.00, 81.00, 86.00
Trading recommendations
Sell Stop 74.90, 73.90. Stop-Loss 76.10. Take-Profit 74.00, 71.82, 71.24, 70.30, 64.70, 63.40, 61.70, 60.40, 59.40, 57.30
Buy Stop 76.10. Stop-Loss 73.90. Take-Profit 78.00, 79.00, 80.00, 81.00, 86.00


