As we noted above, the US dollar continues to strengthen amid growing US inflation. In July, the USD / CAD pair is growing for the second month in a row and was able to return into the zone above the long-term support / resistance level 1.2450 (ЕМА200 on the monthly chart) separating the bullish trend from the bearish one.
A rise into the zone above the resistance level 1.2600 (ЕМА200 on the daily chart) will increase the chances, and a breakout of the key long-term resistance level 1.2960 (ЕМА200 on the weekly chart) will finally return USD / CAD to a long-term bull market.
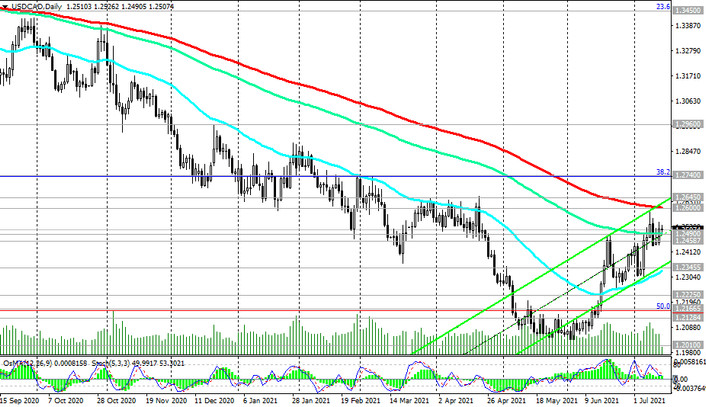
Nevertheless, strong resistance awaits the pair USD / CAD in the area of 1.2600, 1.2645. But a breakout of the resistance level 1.2740 (Fibonacci level 38.2% of the downward correction in the wave of USD / CAD growth from 0.9700 to 1.4600) will increase the likelihood of USD / CAD rising towards resistance level 1.2960. Long positions are preferable in the current situation.
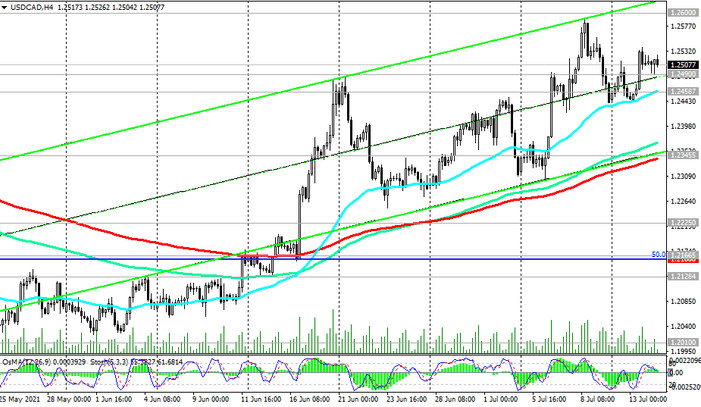
In an alternative scenario, the breakdown of the resistance level 1.2345 (ЕМА200 on the 4-hour chart) will become a confirmation signal for the resumption of short positions, and the first signal for USD / CAD sales will break the short-term support level 1.2458 (ЕМА200 on the 1-hour chart).
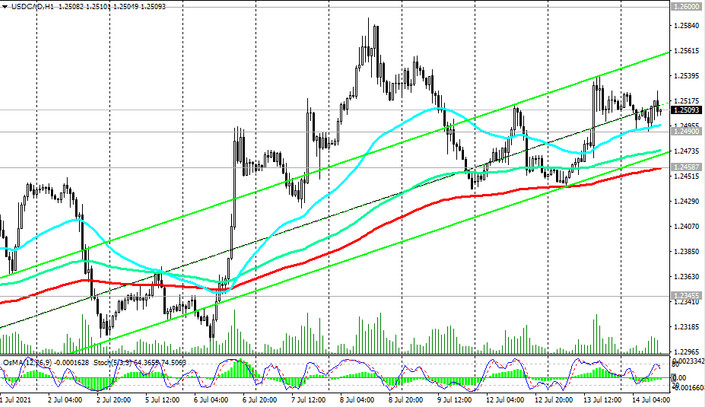
Support levels: 1.2490, 1.2458, 1.2450, 1.2345, 1.2225, 1.2165, 1.2128, 1.2085, 1.2010
Resistance levels: 1.2600, 1.2645, 1.2740, 1.2960
Trading scenarios
Sell Stop 1.2480. Stop-Loss 1.2535. Take-Profit 1.2458, 1.2450, 1.2345, 1.2225, 1.2165, 1.2128, 1.2085, 1.2010
Buy Stop 1.2535. Stop-Loss 1.2480. Take-Profit 1.2600, 1.2645, 1.2740, 1.2960


