At the time of this posting, USD / CAD is traded near the 1.2676 mark. The dynamics of the pair at the moment looks contradictory.
The price broke through the important short-term support level 1.2727 (ЕМА200 on the 1-hour chart) at the beginning of today's European session, which is a signal for a further decline in USD / CAD.
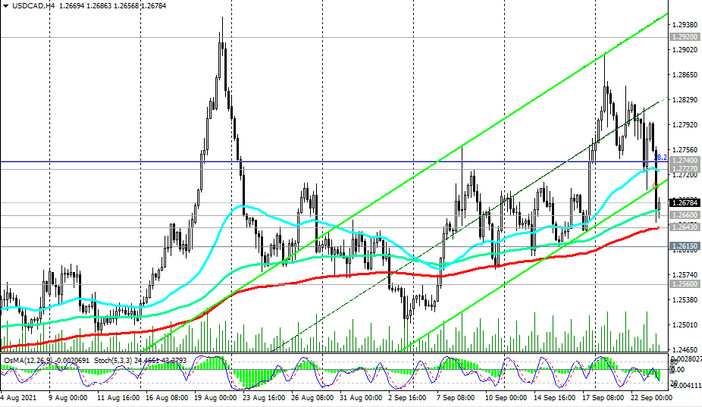
The breakout of the support levels 1.2643 (ЕМА200 on the 4-hour chart), 1.2660 (ЕМА50 on the weekly chart) will provoke further decline with the target at the key support level 1.2615 (ЕМА200 on the daily chart).
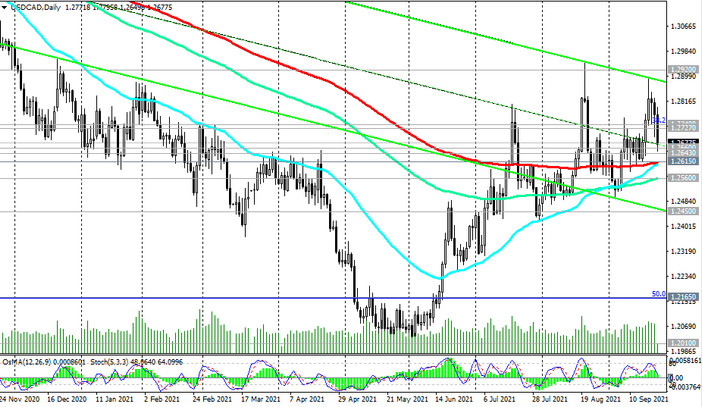
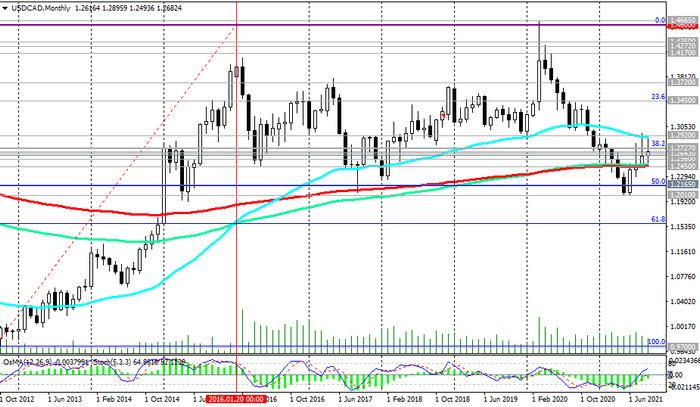
Its breakdown will become a confirmation signal for the resumption of long-term short positions with targets located below the support level 1.2450 (ЕМА200 on the monthly chart) and, possibly, the level 1.2010 (local 7-year lows).
In an alternative scenario and after a return into the zone above the resistance levels 1.2727, 1.2740 (Fibonacci level 38.2% of the downward correction in the wave of USD / CAD growth from 0.9700 to the mark of 1.4600), the nearest growth target will be the resistance level 1.2920 (ЕМА200 and the upper line of the descending channel on the weekly chart).
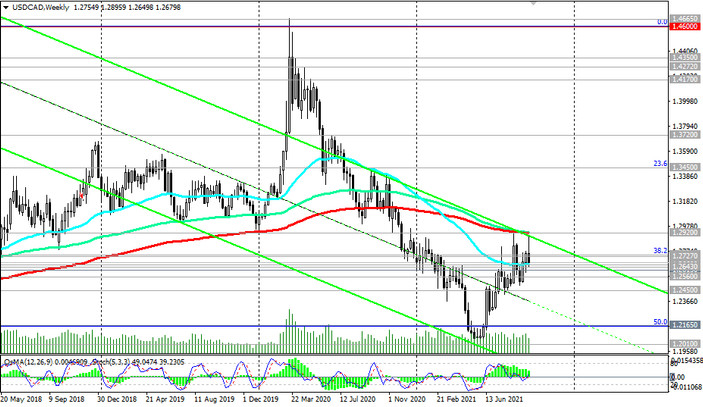
A breakout of this resistance level will confirm the recovery of the USD / CAD bullish dynamics.
Support levels: 1.2660, 1.2643, 1.2615, 1.2560, 1.2500, 1.2450
Resistance levels: 1.2727, 1.2740, 1.2920
Trading scenarios
Sell Stop 1.2640. Stop-Loss 1.2730. Take-Profit 1.2615, 1.2560, 1.2500, 1.2450, 1.2330, 1.2200, 1.2165, 1.2100
Buy Stop 1.2730. Stop-Loss 1.2640. Take-Profit 1.2800, 1.2825, 1.2920

