USD/CHF is traded near 1.0040 at the time of publication of this article, trying to gain a foothold in the zone above the long-term resistance level 0.9965 (EMA144 on the monthly chart). In case of further growth, the key resistance level 1.0450 (EMA200 on the monthly chart) becomes the target for USD/CHF, separating the bullish trend of USD/CHF from the bearish one. A breakout into the zone above this resistance level sets the stage for USD/CHF to enter a long-term bull market zone.
In an alternative scenario, USD/CHF will resume its decline. The first signal for the resumption of short positions will be a break of the local support level 0.9990, and a confirming one will be a breakdown of the support level 0.9965. The first target of the decline is the local support level 0.9871.
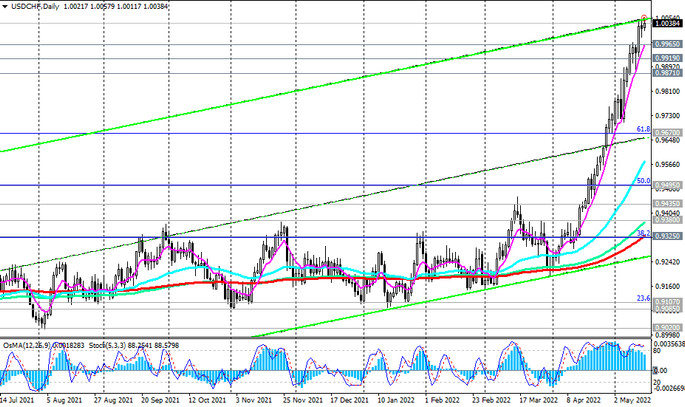
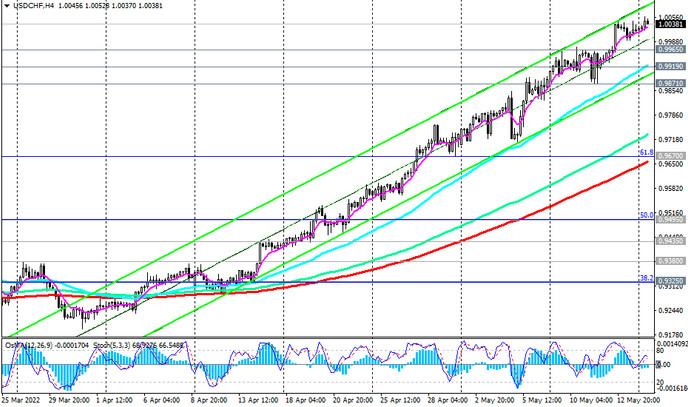
A break of the support level 0.9670 (EMA200 on the 4-hour chart and the Fibonacci 61.8% of the upward correction to the downward wave that began in April 2019 near 1.0235) will mean the end of the downward correction and the resumption of the bearish dynamics of USD/CHF. A breakdown of the support level 0.9325 (EMA200 on the daily chart and the Fibonacci level 38.2%) will return USD/CHF to the bear market zone.
Support levels: 0.9990, 0.9965, 0.9919, 0.9871, 0.9800, 0.9700, 0.9670, 0.9600, 0.9495, 0.9425, 0.9435, 0.9380, 0.9325, 0.9300
Resistance levels: 1.0060, 1.0100, 1.0235, 1.0300, 1.0400, 1.0450
Trading recommendations
USD/CHF: Sell Stop 0.9960. Stop Loss 1.0060. Take-Profit 0.9919, 0.9871, 0.9800, 0.9700, 0.9670, 0.9600, 0.9495, 0.9425, 0.9435, 0.9380, 0.9325, 0.9300
Buy Stop 1.0060. Stop Loss 0.9960. Take-Profit 1.0100, 1.0235, 1.0300, 1.0400, 1.0450