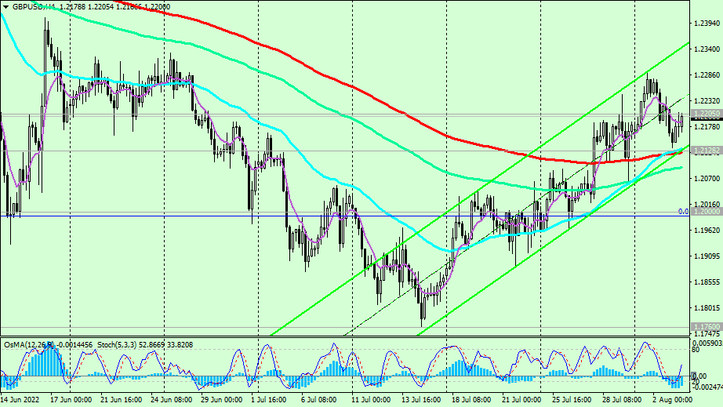
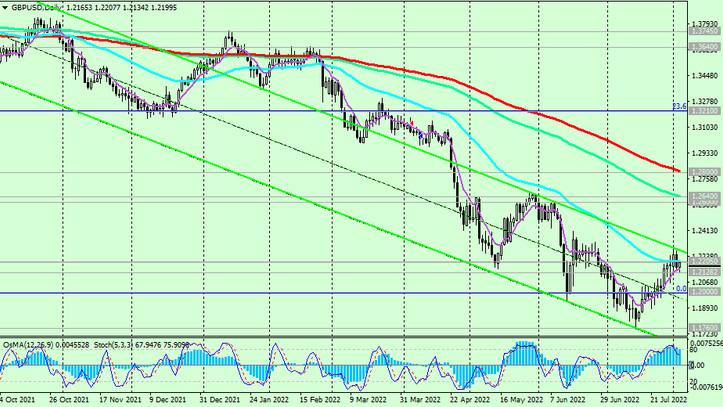
As we have already noted, at the time of publication of the article, the pair is traded near the mark of 1.2205, through which an important resistance level (EMA50 on the daily chart) passes. Breakdown of this resistance level will strengthen the positive dynamics of GBP/USD, and the upward correction will continue towards the resistance levels 1.2640 (EMA144 on the daily chart), 1.2800 (EMA200 on the daily chart).

In an alternative scenario, a breakdown of the support level 1.2128 (ЕМА200 on the 1-hour and 4-hour charts) will cause the end of the upward correction and the resumption of the downward dynamics of GBP/USD.
Below resistance levels 1.2640, 1.2800 GBP/USD remains in the long-term bear market zone.

Support levels: 1.2128, 1.2100, 1.2000, 1.1900, 1.1880, 1.1800, 1.1760
Resistance levels: 1.2205, 1.2300, 1.2400, 1.2500, 1.2600, 1.2640, 1.2800
Trading recommendations
GBP/USD: Sell Stop 1.2120. Stop Loss 1.2220. Take-Profit 1.2100, 1.2000, 1.1900, 1.1880, 1.1800, 1.1760
Buy Stop 1.2220. Stop Loss 1.2120. Take-Profit 1.2300, 1.2400, 1.2500, 1.2600, 1.2640, 1.2800


