Trend lines are an essential part of trading and their "discovery" goes back a long way in terms of trading history.
This tool of technical analysis can be used not only as an indicator of the current trend, but it can also be used as an element in various trading strategies, and we are going to show one such very popular strategy here today.
Strategy application
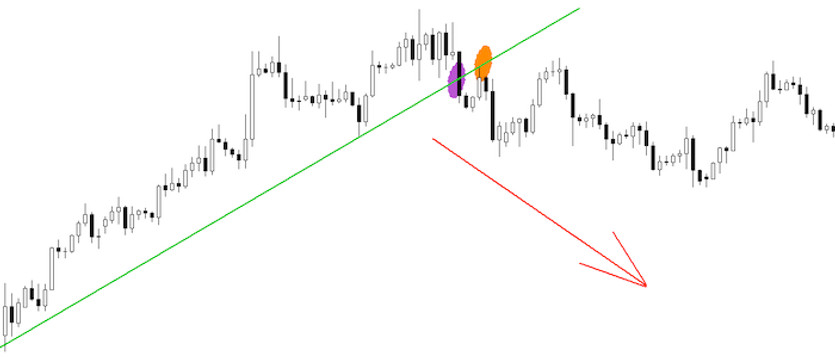
In the case of today's strategy, there is no need to install any indicator and all that is needed is patience and a well-drawn trend line. Here we will discuss a basic trading strategy based on a bounce from a broken trend line. The strategy is really very simple, it only consists of first drawing a good trend line of the current trend (see the red line below), and then waiting for the market to break through this line (a breakthrough is considered to be when a new candle is formed on the opposite side of the trend line). After the breakout, we wait again, but this time for the moment when the price returns to the trend line and hits it (tests it). At this point, it is possible to start making entries in the same direction as the trend line was broken (see below for the downtrend).
In the case of an uptrend, the procedure is analogically reversed, i.e. first there is a breakout downwards from above and then, when the price returns to the trend line (green line on the chart below) and tests it, traders start to execute their entries.
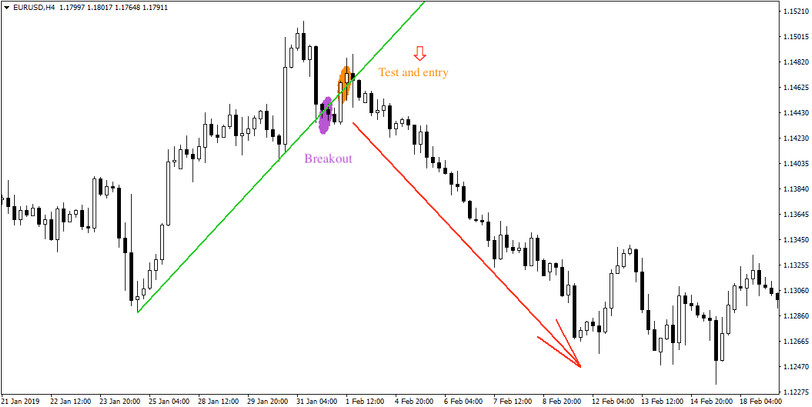
With this basic trading strategy it is possible, depending on the chosen instrument, trading style and time frame, to achieve success rates in the range of 50-80%, which should be sufficient to sustain more conservative and less risky forms of money-management.

