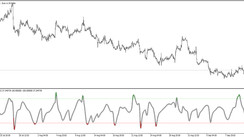
We all know about the MACD oscillator – one of the most widely used indicators in technical analysis.
The main function of the MACD is to show the trend in the underlying asset. To do that, the indicator uses two lines – the “main” MACD line and the signal line.
The MACD is a good indicator of trend and is a very useful tool for trading in trending markets. It accurately shows which way the trend is going at the moment and it can also pick tops and bottoms quite successfully.
However, one key feature that the traditional MACD indicator is lacking, is filtering out the whipsaws. These are the periods in the market between two trends, when there is, in fact, no trend at all. As a result, trying to determine the trend using the MACD alone can be problematic because the MACD shows either a bullish or a bearish trend at any particular moment. It is not able to show neutral periods when the market is moving sideways. Forex traders most often need to use other indicators or methods in addition to the MACD in order to better filter out true trends from choppy, sideways price action.
The advantages of the Robust MACD indicator
The Robust MACD indicator, developed by the Fx Trading Revolution Team, is designed to show both the periods of trending price action and the periods of sideways price action (i.e. no trend).
The Robust MACD is based on the traditional MACD indicator, but it was optimized to filter out trends from ranges with an even higher degree of accuracy.
You can read the technical details about our Robust MACD indicator and download it for free at this link:
Now, let’s see how it compares to the traditional MACD indicator.
The Robust MACD shows the signals a few candles earlier than the usual MACD - USDJPY 4 hour chart
Unlike the usual MACD, the Robust MACD uses colored vertical lines of different height to represent the direction of the trend and the momentum. We can see on the chart that in most cases, the Robust MACD gave the same signal a few bars before the traditional MACD. So, we can say that the improved Robust MACD gives better and more profitable trading signals than the usual version of the MACD.
The sideways price action is indicated by the gray lines on the Robust MACD. The usual MACD indicator does not have this feature as is evident from the chart. This feature can turn out to be a huge advantage in many cases because it can be used as an early exit signal for trend trading.
For example, if you are holding a long trade, and the Robust MACD has turned gray then that could be a signal that the trend is ending. On the other hand, the traditional MACD doesn’t give such a signal until the two lines cross to the downside. Waiting for the lines to cross is usually too late and often results in all profits of the trade been lost back to the market.
Conclusion
Finally, as is usually the case with trading Forex and technical indicators, there is no perfect trading signal, so using the Robust MACD is still about getting the probabilities on your side as much as possible.
You can use it in similar ways as the traditional MACD with the advantage of getting more accurate and more profitable trading signals.


