The use of Pivot Points as an important technical indicator is common in FOREX trading as they help in the determination of overall market trends for different time frames.
Basically, a pivot point is a simple average of the previous trading day’s high, low and the closing price. Trading above this point is considered to a bullish sentiment while trading below the pivot point is an indication of the bearish sentiment.
Pivot points are considered to be very useful since they are purely objective in nature. Contrary to most other FOREX indicators, no discretion is involved in the calculation of pivot points.
Pivot points are often compared with Fibonacci levels since both become self-fulfilling due to the fact that a lot of traders are always looking at them.
Again, it is the objectivity that separates both of them and while some level of subjectivity is still present when trading with Fibonacci levels, pivot points are always calculated with the same or a very similar method; hence, they are even more objective than Fibonacci levels.
Even though pivot points can be useful in a vast range of situations, they are specifically considered to be useful on short-term timeframes, like the daily chart and lower.
Professional traders use pivot points to profit from small movements in the price and since a lot of market participants are looking at pivot points, it can be extremely useful for beginners to plot them on their charts so they can too benefit from pivot points.
While you won’t need to calculate the pivot points yourself as you can find a dozen of indicators that will automatically plot them in your trading platform (especially our Pivot Point Extra Indicator ), it’s still worth knowing the basic formulas for calculating them.
The following is the formula for calculating the middle pivot point, also called the main pivot point.
Pivot Point (PP) = (previous day High + previous day Low + previous day Close) / 3
Since the FOREX market is open and running for 24 hours, different brokers may use different closing times for the day. Most commonly, the pivot points are calculated by taking New York’s closing time as for the “close” value in the formula, and this is the practice of most professional traders. Thus, it’s recommended that we do the same.
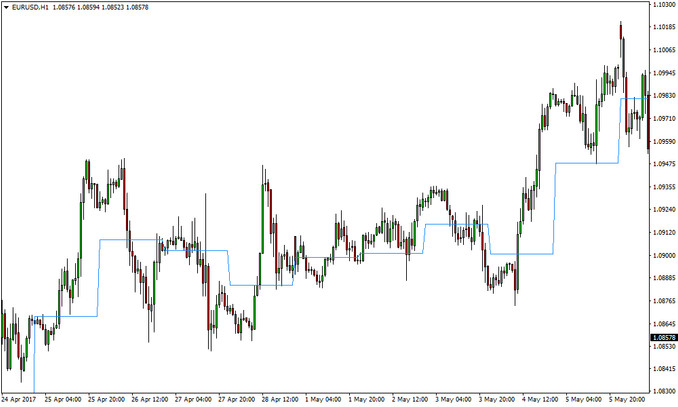
Here’s how the pivot point looks on a chart and how the market reacted to it.

The middle pivot point plotted on a EURUSD 1 hour chart over the course of 10 days
Another important fact to remember is that price will at least touch the middle pivot point once during the day about 70% of the time, as evident from the chart.
Pivot Points can also be used for determining resistance and support levels on the chart. The following are the formulas for the calculation of first, second and the third Resistance and Support levels of the pivot points.
First Resistance Level (R1) = (2PP) – Low
Second Resistance Level (R2) = Pivot Point + (High – Low)
Third Resistance Level (R3) = High + 2 (Pivot Point – Low)
First Support Level (S1) = (2PP) – High
Second Support Level (S2) = Pivot Point – (High – Low)
Third Support Level (S3) = Low – 2 (High – Pivot Point)
Understanding these formulas is useful for getting a grip on the concept of pivot points and their live applications in the market.
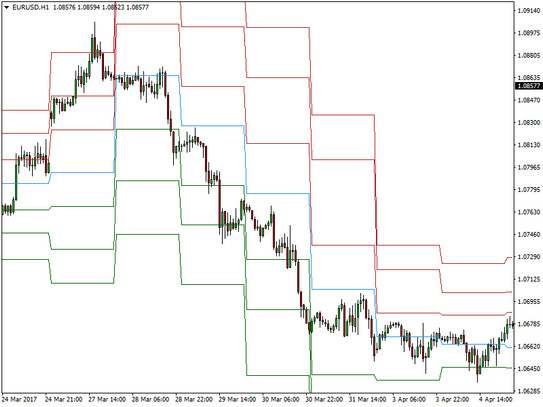
Here’s another EURUSD chart with all the resistance (red) and support (green) pivot points plus the middle pivot point (blue).

The pivot points plotted on a EURUSD 1 hour chart over the course of 8 days
It’s evident from the chart that price most of the time respects the pivot points, either by stopping at them for awhile or even completely reversing from them. It’s fair to say that pivot points are a great tool to estimate the most likely price range for a given period of time.
If you are beginning with pivot points, you can also perform back tests on past data to ascertain the authenticity of pivot points. You can test how price actually reacted to these points previously and adjust your future trading strategy accordingly.
Apart from providing important basic information, pivot points can have various practical applications. For example, pivot points are used for range trading, breakouts trading, placing Stop-Losses or Profit-Targets and measuring the market sentiment.
Finally, you should keep in mind that pivot points alone are unlikely to be enough for profitable trading in the long run, but instead, it’s a brilliant tool which can be combined with virtually any complete FOREX trading strategy, like for example, Price Action Trading or Moving Averages Convergence Divergence (MACD) .


