The Elliott Wave Principle may seem like a flawless trading method in theory, but, in real practical terms when applied to live market charts it can often be difficult to correctly determine where in the Elliott Wave count the market currently is.
Nevertheless, the value of the Elliott Wave Principle is indubitable and although it is certainly not anywhere near perfect, it still offers a disparate and remarkably reliable lens to look at the markets.
Concepts like the 5-wave impulsive structure and the 3-wave, overlapping - corrective structure, are as clear as day to Elliott Wave traders when they spot them on their charts.
On the contrary, an ordinary trader, unaware of the Elliott Waves may often get trapped in overlapping price action believing that it’s the main trend when in fact the price doesn’t go anywhere and will only reverse in the end.
Combining Elliott Wave techniques with other trading strategies that work well for you is certainly a better way to use the Wave Principle than trading it in isolation.
In this article, we will look at real charts from the Forex market, label the correct Elliot Waves and discuss the practical whys and hows of different hypothetical trades.
Elliott Wave Trading Example – NZDUSD
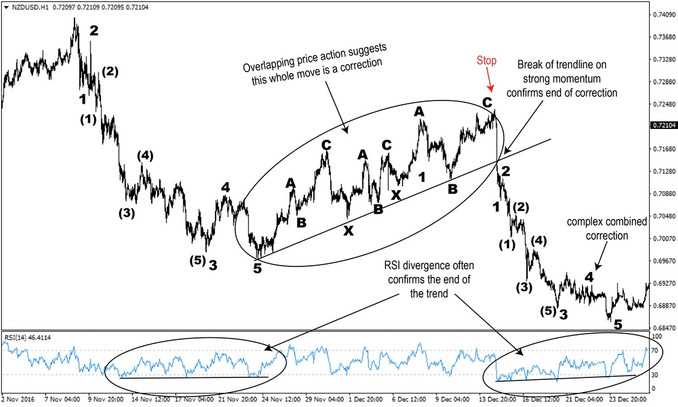
On the following NZDUSD 1-hour chart, we can observe a large Zag-Zag pattern, at least, that’s how much can be seen from this chart alone.
Nevertheless, even on one chart, the difference between the impulsive price action and the corrective - overlapping price action is distinctly noticeable.
The downtrend on the left of the chart clearly follows the 5-wave impulsive structure. It is then followed by a series of overlapping choppy waves to the upside that retrace deep into the prior downtrend, thus having some question if the trend is now up.
It’s critical to realize that the Elliott Wave Principle should not be used to attempt to forecast where prices will go in the future , but rather to identify situations in the markets where we can confidently take high-probability trades.

A breakdown of an ABC - ZigZag pattern, extended waves are marked in parentheses (NZDUSD 1h chart)
In this case, although the NZDUSD is moving up in an overlapping structure, we can not be confident enough to take a short trade (at least barring we looked at other indicators and larger timeframes). The confirmation for the termination of the correction comes when another thrusting wave to the downside violently breaks the retracement trendline.
This is a sign that we can expect the same impulsive nature of the prior downswing to resume and to take us to new lows on the pair, which is exactly what happened. The Stop-Loss for this trade should be placed behind the end of wave C and the start of the new wave 1.
If there is one thing to take away from the Elliott Wave Principle and leave everything else aside, it’s the difference between the impulsive and corrective nature of price behavior. The NZDUSD example demonstrates this crucial point, and taking the time to train your eyes to spot this differences between trends and corrections is a time well spent for a trader.
Think about how much money you can save by simply not trading against an impulsive wave.
Elliott Wave Principle Example – EURUSD
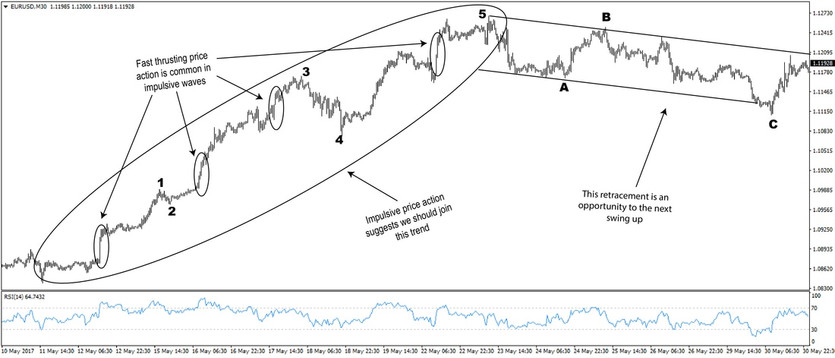
In the next example, we look at a 5-wave structure followed by a ZigZag correction.
The subdivisions of each of the waves are visible on this chart even without switching to lower timeframes. This does not always happen and it is not a requirement, however, it is required for the subdivisions to follow the correct 5-wave structure when you look at the same segment on a lower timeframe.
Fast thrusting price action is common in impulsive waves. What is probably more important but often overlooked is the fact that after the thrust in an impulsive wave, price tends to stay near the highs for a brief period of time and then resume the uptrend.
Contrary to this, fast price action in corrections will usually be quickly erased or the market will spend a very long time consolidating before making a final push lower to end the correction. This is a subtle, but key difference that can help traders to better, and earlier differentiate between trends and corrections.
Thrusting price swings will usually occur as waves 3 because it is the most powerful and usually the longest wave within the structure. Consequently, it is only logical that the wave 4 correction should be shallow which is probably why wave 4 corrections will most often take a complex sideways path.

The Elliott Wave 5-wave structure on a real EURUSD 30-minute chart
Also notice, how the second wave C in the correction takes longer to reach lower lows, and is overall flatter than wave A. This is another key sign that the correction is nearing an end, and that we should prepare for a resumption of the uptrend.
Aggressive traders can even enter near the end of the correction around the end point of wave C in such situations. Anyhow, a strong upside breakout of the downward channel would be the final confirmation that this correction has ended and provide the next entry point for a long trade.


