Price action trading is often regarded as one of the most effective ways to trade the Forex market.
Yet, while it may sound simple at first, reading price action and trading based on it, can be in fact, a very difficult trading method, especially for new traders.
So, what is price action trading exactly?
Pure price action trading is trading based solely on naked charts, without any indicators, lines or any other trading tools derived from the price.
Just the candles and the trader. That’s it!
In contrast to that, and what many newbies opt for, is trading with lots of indicators and lots of signals on their screens. Some even go as far as utilizing a set of complex indicators and end up with their charts looking as a part of a physics lab. The indicators then produce various buy and sell signals that are supposedly proven to work and which the trader should just mechanically execute.
This may reasonably seem like the better idea.
After all, why bother deciding what to buy or sell yourself when you can have a proven and simple system do it for you?
Unfortunately, this is not how things usually work in Forex trading.
The reality is, mechanical systems are almost never profitable in the long run. Hence, being a consistently profitable trader in the long run, is not about cluelessly following trading signals and just hoping for the best.
Consistent profitability in Forex trading is built on an understanding of the market, understanding how price reacts in different scenarios in the market and then picking high probability setups based on that understanding.
In this article, we will look at a few real-world examples and examine how reading the price action gave credible clues for the price developments that followed. Of course, that is not to say that trading on price action is perfect. Losses are still a risk and appropriate protective measures should always be taken.
Signs that Support Will Not Hold - USDJPY 4-Hour Chart
More often than not, price action gives us clues whether a support or resistance level will be broken or not. Sure, sometimes a news report will hit the wires and the price will just blast through support, but that’s usually the exception. Almost always there is a bias in the market, either a bearish or a bullish bias and reading price action gives us clues as to which bias is present at the moment.
Taking a look at this USDJPY chart, we can notice that the support, formed on the left side of the chart, was challenged two more times on the right side of the chart. Yet the price stayed close to the support level for 6 – 7 more sessions without any sign of a rebound.
This was a warning sign that the probability of the support breaking was high.
It is not just the fact that the support was challenged multiple times, but the accompanying fact that there was almost no rebound from the support was an even stronger signal that this support will not last long.
And indeed, the price slowly drifted lower and finally, it traded through the support zone after which USDJPY fell by another 120 pips.
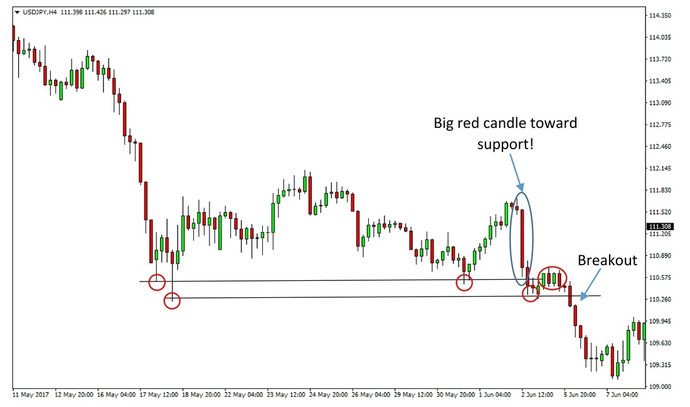
Support that is penetrated multiple times will eventually get weaker
Watching the Thrusts – EURUSD 1-Hour Chart
Thrusting price swings are another situation that is clear as day to price action trades but is hard to capture with any sophisticated technical indicator.
Thrusting price action is usually a sign of a trending market, and thus, thrusts usually appear as part of a strong trend.
In this EURUSD chart, a bullish trend is intact accompanied by higher highs and thrusting price action to the upside. Everything is good until the last swing up – retracements are not deep and the price generally follows the normal behavior of a trending market.
After the top was put in place (first orange circle), the price changed behavior and soon thereafter thrusting price action started going to the downside. This was a sign of a reversal in the market sentiment, and any bulls riding this uptrend were better off getting out of the way.
The downtrend that followed entirely erased the gains of the preceding uptrend.
Hence, over the long-run, it pays to be on the side of the thrusting price action and avoid betting against it.
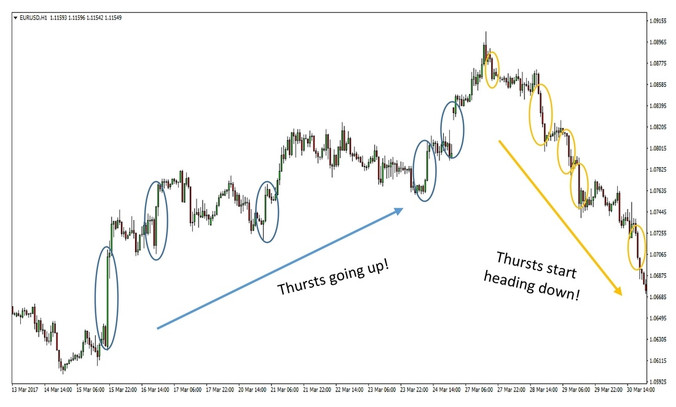
When the thrusts change direction so will the trend
Watching the Highs and the Lows – NZDUSD 5-Minute Chart
In an uptrend we want the market to be making higher highs and higher lows, without making lower lows.
In a downtrend, we need the market to make lower lows and lower highs without recording pronounced higher highs.
In this sense, the lows and the highs define the trend.
Very often, for example, a change from higher highs and higher lows to lower highs and lower lows will lead to an end in the trend or the start of a deeper correction. Either way, if we were in the trend we want to be out when this happens because there is no way to know whether the correction will be just a retracement or a complete reversal.
On the chart below, the downtrend on the left side is proceeding normally, making lower lows and lower highs. All the way to the bottom this was the normal price action, when finally after the second deeper retracement the price moved higher than the previous high and recorded a higher high – marking a shift in the momentum.
What followed was an equally strong trend, only in the contrary direction. NZDUSD made up the entire losses from the preceding downtrend as a result.
Thus, the main takeaway is that the highs and the lows are an important metric to watch when trading the market based on price action. In addition, consider that most chart patterns incorporate highs and lows as their fundamental building blocks, thus boosting the price reactions when such shifts in the structure of highs and lows occur.
Finally, why learn a bunch of chart patterns that are all based on the lows and highs in the market when you can just focus on the main thing and still end up with the same or better results.
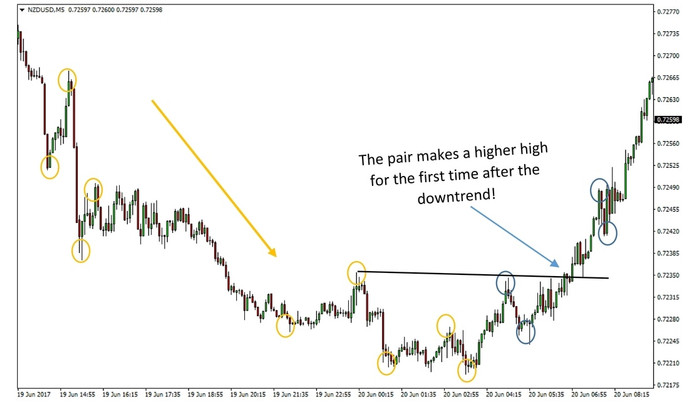
The onset of higher highs and higher lows signaled the reversal here


