Buying low and selling high is the primary goal of every trader, and there is no better market to do that than a ranging market.
When the price is bouncing continually between two levels on the chart trading is an easier task to do. - We just need to buy at the bottom and sell at the top of that range and we can make a profit.
However, in the real market things are not always so simple and the price doesn’t always bounce between two perfectly horizontal lines. That’s why different indicators were constructed to try and predict the most probable trading ranges in the market. One of the best indicators for this purpose are definitely Bollinger Bands.
In this article, we’ll look at a strategy that helps traders to better filter out good trading opportunities in a more realistic ranging market – that is as defined by the Bolinger Bands. Furthermore, the ADX (Average Directional Index) is used to complement the Bolinger Bands and confirm the range before taking a trade.
Although, the use of Bollinger Bands is definitely not limited to range-trading it’s still an indicator that accurately predicts the trading ranges of the price action for a given trading session. Thus, it’s a good indicator to buy and sell at its extremes as price often stops and reverses at them.
However, the risk to that is when a strong trend develops in which case price just continues to trade near one of the bands and starts to behave in a way that is known as “walking the bands”. This is a dangerous situation to trade against as it often means that a strong trend is in place. To help us avoid these situations as much as possible we combine the Bollinger Bands with another indicator – namely the ADX.
Make no mistake, Bollinger Bands can also be used in trend trading very successfully as the indicator is probably one of the most diversely used in Forex trading. In the end, it depends on how you are using it and on which parameters you are focusing on and basing your strategy on. For this specific strategy, we take the Bollinger Band as a ranging indicator and we are particularly interested in the extreme zones of the indicator – that is the upper and the lower band.
The ADX, on the other hand, is trend indicator that helps in identifying how strong the current trend is – starting from no trend with low readings of the ADX to strong trend when the ADX readings are high. Consequently, traders can decide to trade a trend trading strategy when the ADX shows a trend and trade a ranging strategy when the ADX shows that there is no trend.
Parameters of the strategy
Now, let’s get into this Bollinger Bands - ADX strategy and explore how it works.
ADX falling and below 25
Since this is a range-trading strategy we look for the ADX to indicate a sideways market.
The first two basic conditions for this strategy, therefore, are for the ADX value to be below 25 and for the ADX line to be either roughly flat or declining.
When the ADX is above 25 it is an indication that the market is trending - thus it’s better to avoid taking trades at the top or bottom Bollinger Band in these cases because the market might just as well start to walk the bands and develop a strong trend against your position.
To further confirm that the market is not trending we look for the ADX line to be declining in addition to being below 25. This is because even if the ADX line is below 25, if it is sloped upwards it could mean that a new trend is developing. When the ADX line is falling, on the other hand, it’s a sign that the previous trend is losing its momentum.
Price at or near one of the Bollinger Bands
So, after the conditions for the ADX are satisfied, the price needs to trade close to or at one of the Bollinger Bands. Once this has happened and the ADX conditions are still intact we can look for the price action to start showing some reversal signs and give us potential entries. Switching to lower timeframes is a good way to analyze the price action and to look for triggers for the trade while having the setup on a larger timeframe.
Classical chart patterns, candle patterns or other trigger signals that you may prefer can be successfully used to confirm a reversal at the Bands and take a trade.
Target
The target with this strategy is the opposite band of the one where the trade was initiated.
So, in a bullish signal, a long trade is generated at the lower band with a target at the upper band. In contrast, with a bearish signal, a short trade is generated at the upper band with a target toward the lower band of the Bollinger Bands indicator.
Trade examples
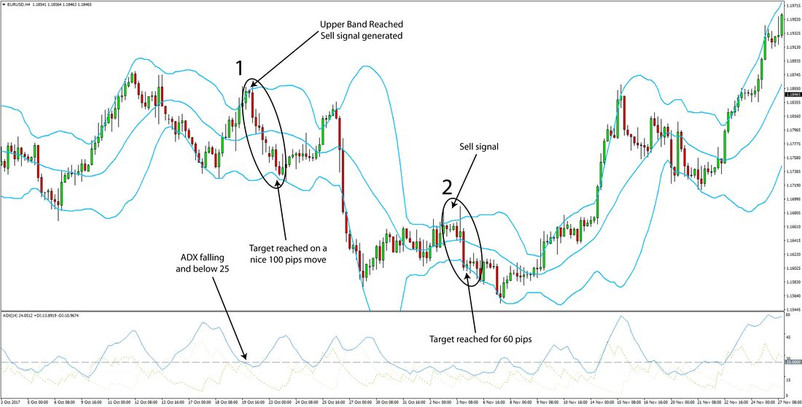
Here are some real-life examples of how this strategy worked. On the chart below, two trades are shown on the EURUSD pair (4-hour chart) that were generated by this strategy.

Bollinger Bands and ADX trade examples on the EURUSD 4-hour chart
In both cases, marked 1 and 2, all conditions of the strategy were satisfied. The ADX was falling and below 25, the price reached the upper Bollinger Band and there were reversal signs around these levels.
In contrast, on the right side of the chart, there are two instances of the price walking the bands which are confirmed by the rising ADX. This is why, as we said earlier, we cannot just blindly take trades at the Bands and why we need the confirmation from the ADX and the price action before taking a trade with this strategy.
Finally, as always be sure to test this strategy on your own and do plenty of demo trading before using it in your live trading.


