Some indicators are more popular than others, but there are some that traders have hardly heard of and yet they are highly used technical analysis indicators at the professional level.
One such indicator is the RVI, which will be the centerpiece of our next very simple trading strategy today, which, thanks to its simplicity, could find favour not only among technically based traders, but also, for example, among some fundamentalists.
Today's strategy entry rules
Entering long positions
-RVI curve (RVI style) is below the zero boundary
-the curve is upward sloping
Entry into short positions
-the RVI curve (RVI style) is above the zero bound
-the curve is downward sloping
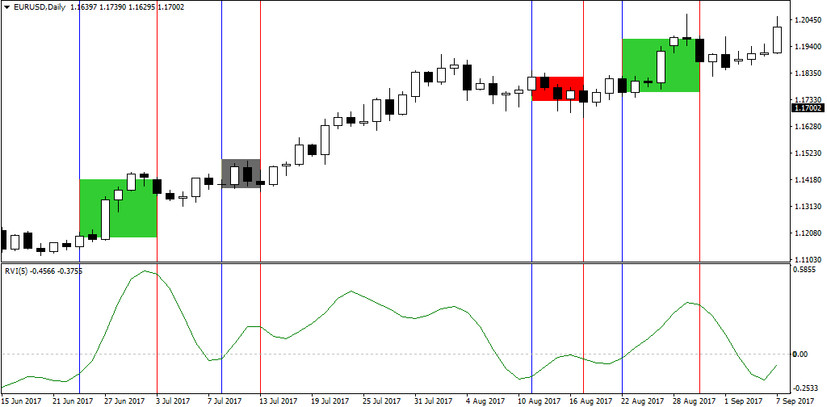
In the chart below, we can see trades that start on the hill (the local RVI peak) and end when the RVI curve either turns to neutral (horizontal direction) or jumps straight to the rising direction.
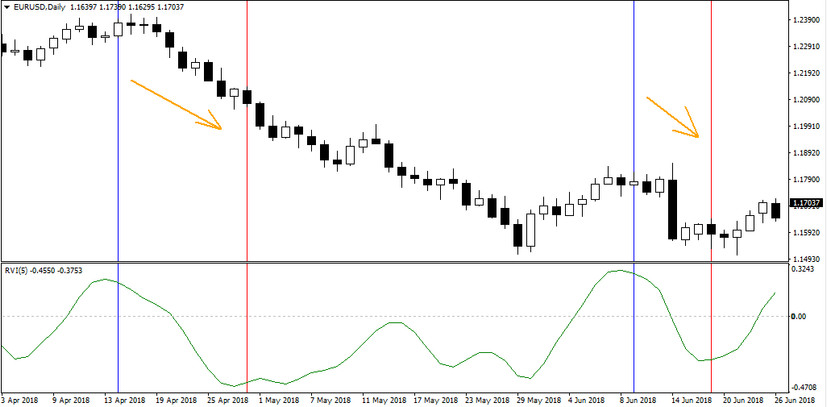
The next chart below, on the other hand, shows situations where trades start in a so-called ravine and end when the RVI curve either turns neutral again (horizontal direction) or jumps straight into the downward direction.
Today's strategy based on the RVI indicator allows to achieve success rates in the range of 50-75%. The final success rate is influenced not only by the instrument on which the strategy is used, but also by the specific RVI setting, the optimal values of which can vary considerably for different currency pairs.