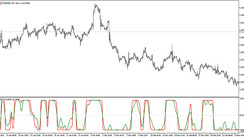
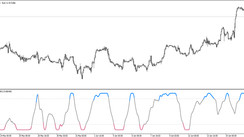
Indicators that predict trend changes are among the most popular and most used by traders. One of such indicators is the Williams percentage range, which have also built up a large fandom base of traders over the course of their existence.
A unique feature of the Williams range is that it can predict a change in trend to some extent. This indicator almost every time makes lows and highs before it starts to fall and rise, which is of course its greatest strength.
Application of the strategy
The strategy of entering according to the Williams percentage range is based on reaching certain thresholds of this indicator, which represent a signal when the market is already potentially overbought or oversold.
One of the trading strategies for trading with the Williams percentage ranges is by using the trend line and indicator levels (-10,-90). If the price is below the trend line, then traders wait for the Williams range to reach -10, conversely, if the trend line is below the price, then they wait for the Williams range to exceed -90.
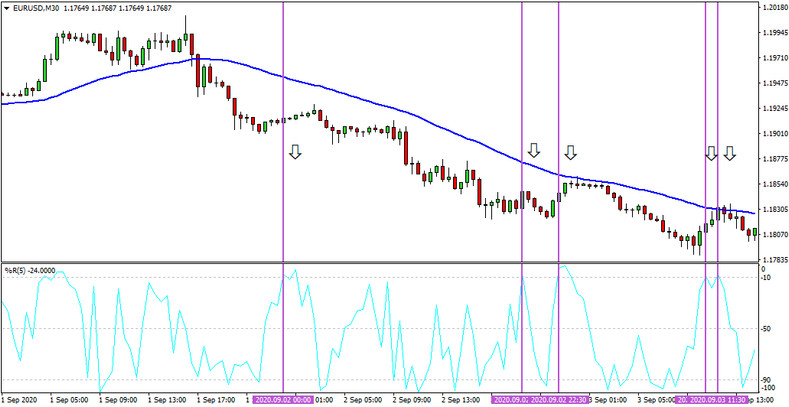
For the next strategy, on the other hand, it is possible to use the "mid" value of the Williams range of -50 together with the trend line again, where if the price is below the trend line, then entries are only made when the curve of the range crosses the -50 level from top to bottom. On the contrary, if the price is above, then it is necessary to wait for the passage from the bottom up through the -50 level.
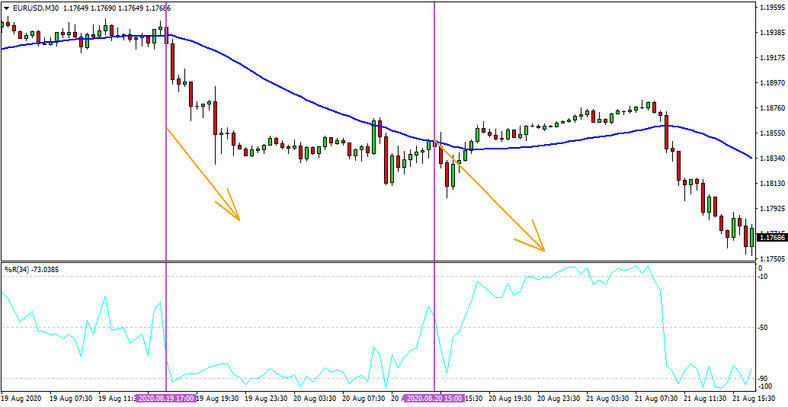
With today's strategy based on the Williams percentage range, it is possible to achieve success rates in excess of 65%. However, the best results within this strategy can be achieved when trades are executed in accordance with the current trend setup, which is undoubtedly the main factor here that highly increases the success rate of this strategy.


