Support and resistance are the foundation for nearly every technical trading strategy. Anyone who has experience in trading Forex or any other market has heard about support and resistance levels.
Many different methods exist to determine support and resistance levels, from the classic horizontal and sloped trendlines to Fibonacci ratios, Pivot Points, and other advanced indicators.
They all aim to pinpoint the most probable reversal points in the market, but, nevertheless, none of them is perfect.
Support and resistance levels rarely work as precise points on the chart where the market reverses or not. Many new traders may overlook this important fact about support and resistance levels. The levels are not an exact science that can tell you where the market will reverse exactly. Rather, it’s more about probabilities and possible scenarios.
So, although we refer to them as support/resistance levels, prices are, in fact, rarely reversing at the exact support or resistance level. Technical support and resistance levels can often be very precise predictors of market reversals, yet these levels are not something that will always pick the reversal with the precision to the pip.
What you’ll notice most of the time is that the price turns in an area close to the specific support or resistance level instead of exactly at the level. Maybe this area (or call it a zone if you like) is only a few pips on intraday charts while on a weekly or a monthly chart it could be 100 or 200 pips.
The key point to remember is that the price reacts to the support and resistance levels more as areas rather than to the precise levels themselves. This is very important because many times rookie traders think that a breakout is occurring only to see the price reverse a few minutes later. And, of course, then they lose on the fake breakout.
For example, take a look at this real world chart of the EURUSD pair as an illustration of the above point.
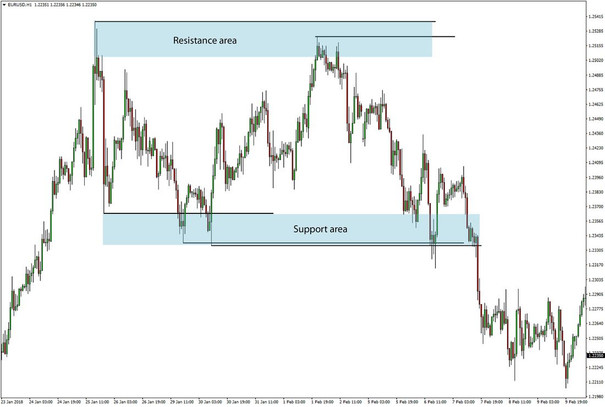
EURUSD 1-hour chart - Support and resistance levels are shown with the black lines, while the areas are painted in blue
Notice how the price reversed near the resistance levels, but not exactly at them. We have highlighted the whole resistance zone to make things easier to recognize. Then, a similar thing happened with the support levels. The price fist pushed below them and then came back above them. The true breakout to the downside occurred when the whole zone (area) was broken on strong bearish momentum.
So, when looking at support and resistance remember that it’s not a fixed level, but rather an area/zone where the price may reverse. So, if the price is breaking above a resistance level it doesn’t immediately mean it’s a breakout. The price may just poke above the level and then reverse. But if you were looking at the broader area of resistance you would have known that a reversal is still possible.
A good way to use support and resistance is, therefore, to look for some sort of confirmation before taking a trade, instead of taking trades just because the price has reached a support or resistance zone. So, confirmation would be a bounce at support, a reversal pattern or perhaps a signal from some other indicator that you are using.
Waiting for the confirmation is so important, especially when you are a beginner. It’s simply the safer and higher probability approach. A bullish pattern or a bullish signal occurring at support (and hence confirming it) ought to be a much better long trade than going long either on support or the bullish signal alone.

