When you trade Forex, you want to be as sure as you can be about where should you put your money. You can try different methods, but one that everyone learns to appreciate is technical analysis.
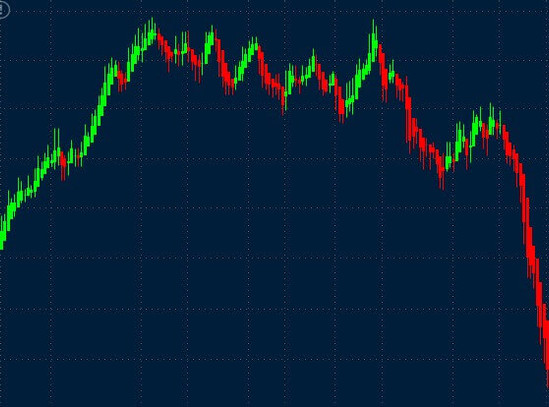
Technical analysis is the study of market prices with charts. Traders try to determine the supply and demand, predict the direction a currency will take in the future. Here is where the tick charts come in handy.
They’re less cluttered
Comparing tick charts with a time-based chart, you will quickly notice how the tick charts are simpler to follow. Tick charts work with price changes instead of time intervals - updating whenever a new tick occurs (each price change). Time-based charts show the prices traded in a pre-defined period of time, making them harder to read during long periods of low activity.
You can understand volatility better
With tick chart, it is easier to know how volatile a currency pair is because they get new bars only when enough trades are made to validate them. Looking at a time-based chart, you can miss the volatility of the market. With tick charts, more bars will appear when the number of trades is high, and there will be fewer bars when the number of trades decreases.
Swings are clear
As a trader, you need to use different strategies to make smart investments. Swings trading is a good strategy for short-term traders, where you focus your investment on trending currency pairs. Tick charts more clearly show each swing in a given currency pair, which can be an excellent aid for swings traders.
Clearer breakouts
Whenever a breakout occurs on the market, you can notice it immediately on the tick charts. This event gives opportunities to the traders, letting them get better entry and exit prices. The graphics on tick charts show the tendency of the market; that way, the trader won’t miss the trading opportunity waiting to be sure of the outcome.
Technical indicators work better
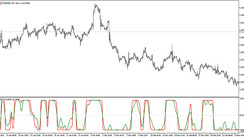
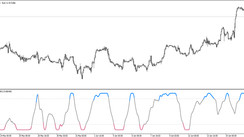
The technical indicators are more accurate on tick charts. It is because the tick charts show the trades that have relevance on the market; that way, the traders don’t get distracted with other less significant trades. It is easier to notice essential signals on the technical indicators in tick charts, while time-based charts may not show these signals.

Volume is easier to measure
Looking at the bars on tick charts, you can easily spot when those bars have a higher volume, which usually indicates that it is a great investment opportunity. Combining tick charts with measurement of volume can make you a smart trader, and give you more opportunities to obtain higher income.
Stop-losses can be determined more accurately as well
It is hard to keep up with the rapid movement of prices in the Forex market, especially with time-based charts that will show only a couple of bars as your options for stop-loss orders. Tick charts show each attempt of the price at that specific technical level you are considering for a stop loss.
Tick charts make up for the low activity
The speed of the trades in the currency market fluctuates without a specific pattern, so traders often have to spend a lot of time looking at the charts waiting for the right opportunity. Tick charts help to make this process less dull during the hours of low activity, letting you know when the movement starts. Tick charts are becoming an essential tool for chartists and traders.


