You have probably noticed that we frequently talk about the 50, 100 and 200 period moving averages in our daily and weekly posts that are regularly published in the FxTradingRevolution news section.
Now, you may be wondering why we are focusing on those moving averages specifically and why they are so important. People use all kinds of moving averages on their charts, but the group of these 3 is particularly common in the trading world. More importantly, it’s even more common among professional and successful traders.
Considering that one of the basic rules of technical analysis is essentially a self-fulfilling prophecy, it’s no wonder that these 3 moving averages work so well in the Forex market. Basically, the more people look at and trade by the same price level the more likely it is for that price to be important in some way (i.e. to be a point of reversal). Since a lot of traders are plotting the group of the 50, 100 and 200 moving averages on their charts, it only makes them a more reliable trading indicator.
But, we are not going to go into what are moving averages, how they are calculated or any basics of that kind in this article. You can read more about that in the general article on moving averages here.
Instead, in this post, we’ll only discuss the group of what are probably the 3 most important moving averages that a trader will ever need.
Before we get into the details on how to use the 50, 100 and 200-period moving averages, let’s start with some preliminaries regarding the contexts in which they are used. This is as important as knowing how to trade them and what the trading signals mean.
- So, first of all, there are some different variations of these 3 moving averages that are commonly used. Generally, though, the most popular calculation for the 50, 100 and 200 period moving averages is the simple moving average (SMA). Of course, some traders like to use the weighted (WMA) or the exponential moving averages (EMA), but most of the time and most traders use the simple 50, 100 and 200-period moving averages on their charts.
- Further, some traders prefer the 55-period moving average instead of the 50-period, mainly because the number 55 is part of the Fibonacci sequence. However, again, the 50-period moving average appears to be the more popular option among traders, although that doesn’t mean that it’s going to be the better option for everyone. Here, like in many other areas of trading the markets, it all comes down to preferences and to what works best with your strategies.
- Finally, a key aspect to keep in mind is that the 50, 100 and 200-period moving averages are most commonly used on the daily chart and therefore tend to be a more reliable trading signal on this timeframe. Consequently, you will often find them being referred to only as 50-day, 100-day and/or 200-day moving averages.
- In contrast, they are rarely if ever used on intraday charts, thus the accuracy of any trading signals generated on lower timeframes is questionable.
The 50, 100 and 200 daily moving averages can be viewed as dynamic areas of support or resistance, but also a crossover between those moving averages has some significant implications for the asset or currency pair that you are analyzing.
The 50-day, 100-day and 200-day moving averages as support and resistance
To use these moving averages as support and resistance you only need to look at them as any other support or resistance level (or area) on the chart. What you will find is that the price will often respect these 3 moving averages, particularly on the daily but also on the weekly and monthly charts.
Although we said that their most famous implementation is on the daily chart, the weekly and monthly timeframes also give highly reliable trading signals. So, basically, as is the case with any signal in technical analysis, the higher the timeframe the more significant the signal tends to be. Thus, a 100-week moving average will tend to be somewhat stronger support/resistance than the 100-day moving average.
There is no big difference between the 3 moving averages in the way they should be viewed or traded.
The 50-day (or 50-period) moving average appears to be somewhat less significant than the 100-day or 200-day moving averages, although the 50 is definitely still a very important level to keep an eye on. Generally, however, the 100 and 200 period moving averages (whether on the daily, weekly or monthly chart) have a tendency to be stronger support or resistance than the 50-period moving average.
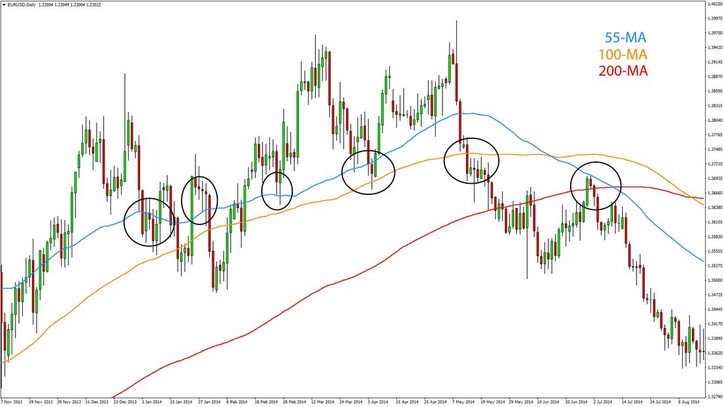
The following is a chart example of how the 50-day, 100-day, and 200-day MAs worked as support and resistance.

EURUSD Daily chart
Notice how many times the price stopped at, reacted to and reversed from the three moving averages. Then, after breaking them it often re-tested the support/resistance from the other side.
The golden cross and the death cross
Another important signal that these moving averages send is a crossover between the 50-day and the 100-day moving averages.
Essentially, a bullish crossover (the 50-day MA moving above the 100-day MA) is called a golden cross and it signals that a new bullish trend is starting.
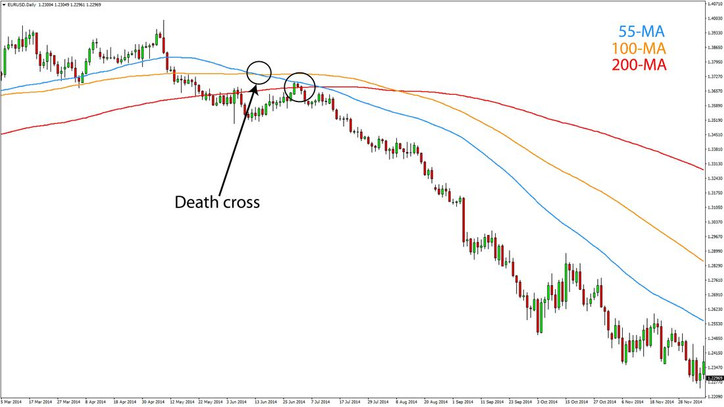
A bearish crossover where the 50-day moving average crosses below the 100-day moving average is known as the death cross. This is a sign that a bear market may be starting.

The death cross was the first sign for the bear trend and then the 50-day moving average held as resistance - EURUSD daily chart
Of course, a golden cross or a death cross on the chart is not a definite signal that a major uptrend or downtrend is coming, but it is a valuable sign of reversal especially when confirmed by other tools and indicators.


