When looking at a chart without any indicators or tools on it, it can be a bit difficult for a trader experienced or not to understand the reasons behind price movements or how the asset is going to behave in the future.
This is why over the years, traders have developed various tools and means for analysis to help them break down the complex information received into understandable pieces. With these tools, traders can better understand the intricate details of the price action of an asset and make trading decisions based on that.
One of these tools is chart drawing tools.
What are Chart Drawing Tools
Chart drawing tools can be regarded as a key part of a trader's technical analysis toolset. They are instrumental in spotting patterns, identifying levels of support and resistance, confirming potential trends and breakouts, and determining market timing. There are two main types of drawing tools:
- Non-analytical drawing tools: On their own, these tools do not necessarily examine price information and do not help to predict future price action. Their basic function is to highlight key areas on a chart or enter information regarding the chart. Tools like ellipses, text drawing tools, and rectangles are in this category.
- Analytical drawing tools: This set of drawing tools help to identify chart patterns and analyze relevant price information. Tools like Fibonacci tools and trend lines fall in this category.
Since these tools are an important part of any trader's arsenal, most trading platforms come with different drawing tools as part of their package. You can see something as common as trend lines to more complex tools like the Fibonacci fan, Gann fan, and Andrew’s Pitchfork.
Chart drawing tools also help to draw your attention to certain areas on the chart by marking particular time levels and discovering the best entry and exit points for a trade.
Best Chart Drawing Tools
While there are a lot of tools available to traders, some tend to stand out. These are tools that are commonly used by traders to make accurate predictions and they often have multiple functions that traders can enjoy. Plus, they are easy to use and even a beginner learning how to trade in any financial market can have a good idea of how to use them after a couple of tries.
These are the best chart drawing tools available to users:
XABCD
The XABCD drawing tool is a tool that helps traders to highlight 5 points chart patterns. These points form the structural foundation for harmonic patterns. The five points show different high and low prices and to show different chart patterns, the separate points are combined to form four legs which are XA, AB, BC, and CD. These four legs represent various price movements and trends. Also, the XABCD points can show natural support and resistance levels on the chart.
To identify the XABCD pattern, you should look out for any of these major chart patterns displayed by the XABCD drawing tool are:
- Butterfly Pattern: When looking at the bearish butterfly, there is a retracement of 0.786 from AB to XA. BC is a retracement of AB by 0.382 to 0.886. CD is an extension of AB by 1.618 to 2.24. Point D is an area used to confirm whether the price of an asset is going to act as expected and it is a 1.27 extension of the XA.
- Gartley pattern: For this harmonic pattern, BC is a 0.382 to 0.886 retracement of AB. Leg CD is an extension of AB by 1.13 to 1.618. Point D which is the potential reversal zone is a 0.786 retracement of XA.
- Bat: The Bat pattern looks like the Gartley pattern but the measurements for it are different. BC is a 0.382 to 0.886 retracement of AB. CD is an extension of AB by 1.618 to 2.618 and D is a 0.886 retracement of XA.
- Crab: The crab pattern is also similar to the butterfly in appearance and the best way to tell it apart is through measurements. BC is a 0.382 to 0.886 retracement of AB. CD is a 2.618 to 3.618 extension of AB and point D is a 1.618 extension of XA.
Regardless of the harmonic pattern that forms, a bullish harmonic pattern tends to look like the letter M when it forms and a bearish pattern takes the shape of the letter W. Also, you can draw the XABCD pattern manually if you have experience doing it but this will take some time because each pattern has different ratios that need to be considered.
Ellipses Drawing Tool
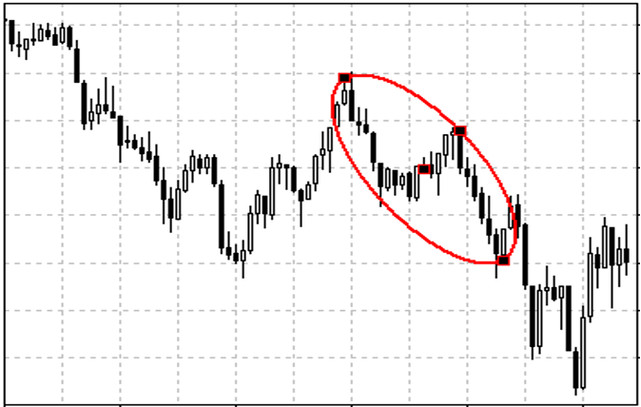
Ellipses is a popular drawing tool on most trading platforms that are not drawn based on Fibonacci ratios. They are usually oval and for trading purposes, they are converted to phi ellipses.

Phi ellipses are drawn on charts to examine the current market patterns like uptrends, downtrends, pullbacks, and trend reversals. When the ellipses are converted into phi ellipses, it becomes a Fibonacci that shows the price direction of an asset and can help highlight relevant past price action that can help traders decide whether to buy and sell.
Also, they are used by traders and investors to trade or invest in securities like stocks, currencies, stock indexes, and futures. Phi ellipses are usually drawn by a computer or come as part of a trading chart software package because it requires precise measurements for accurate results.
When it is not converted to phi ellipses using mathematical calculations, ellipses remain a fundamental drawing tool used to highlight key areas on a chart like oversold or overbought conditions, price gaps, and peaks and areas.
Some trading platforms that come with this tool, allow you to change the color and thickness of the ellipses especially if you are drawing multiple in different areas of the chart or need it for different timeframes.
To draw ellipses, select the timeframe and portion of the trend you want to examine. Define your first and second points on the chart and adjust the ellipses until you get the required shape and size.
Trend Line Indicator
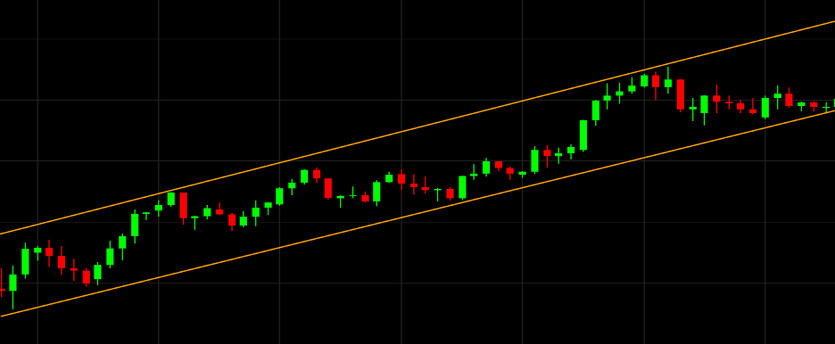
A trend line indicator is an analytical drawing tool used for drawing trend lines. Trend lines are lines that show the trend or direction of price in a financial market.

For instance, an upward trend line signifies that the market is bullish while a downward trend line is a sign that the market is bearish. It is also easier for traders to spot potential trend reversals with trend lines because their attention is instantly drawn to how the market moves away from the current trend.
Along with identifying price movements, trend lines connect 2 or more high and low price points in a chart to identify areas where there is support and resistance. Most trading platforms that come with this drawing tool, enable you to add two or more trend lines to the same chart window and these lines can be adjusted based on time, price, and other factors to reflect what the trader wants to see. The trendline drawing tool is also used by traders to highlight certain areas in a chart.
Conclusion
Most trading platforms represent the chart drawing tools with symbols and the tools can be adjusted and formatted on the chart as desired by the trader. Since these tools are important in market analysis, the trading platform you choose must have the necessary tools for successful trading.


