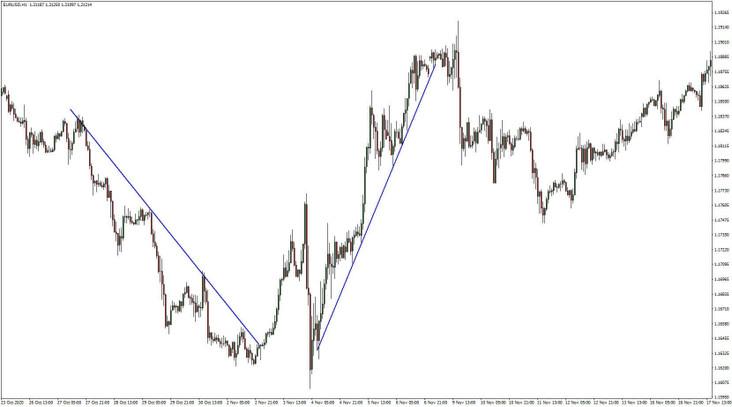
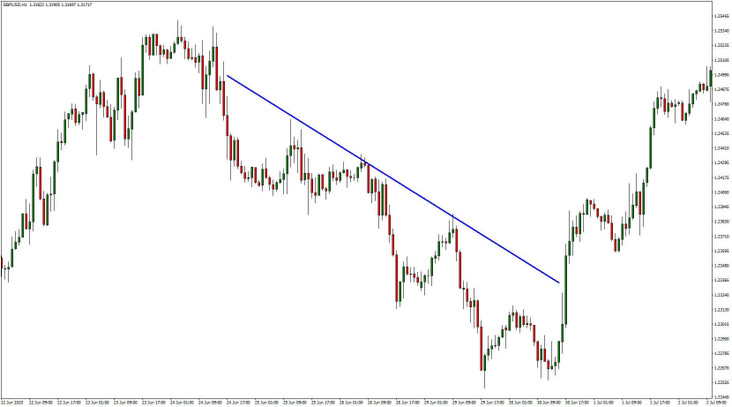
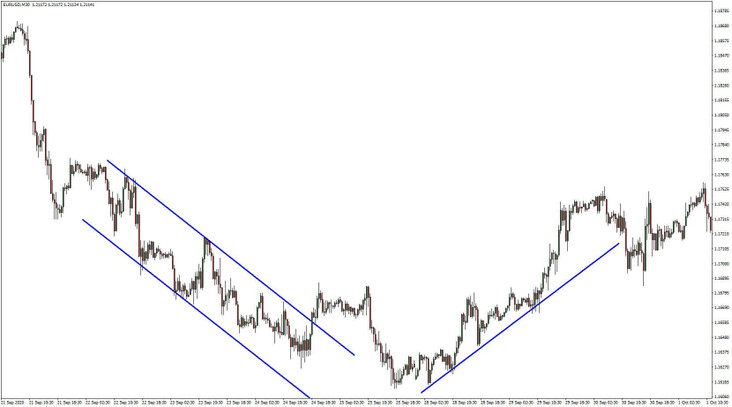
When trading using trend lines, you are waiting for a moment when the price of an instrument gets to a certain price level, off of which the market is very likely to bounce.
When using this strategy, every trader has to remember that the market can react two different ways:
The example of the trading strategy here was designed to show only the above-mentioned option No. 1.
For a trader to be able to fully take advantage of the potential of the trend line strategy, he first has to be able to correctly draw trend lines.
How to draw trend lines and how to improve?
To draw a trend line, you need at least two points. If a trader wants to draw a trend line for an upward trend, the market has to create at least two swing lows. For a downward trend, the market has to offer at least two swing highs.
See the graphic explanation of how an upward trend line is drawn:
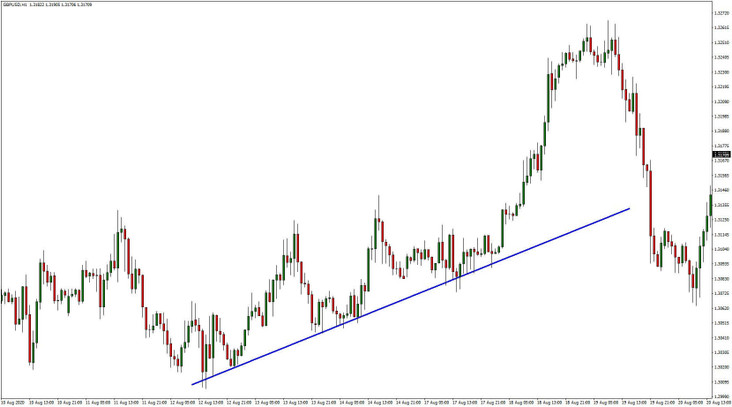
For some traders, it might be easier to draw a trend line on a line chart (like on the picture above), where the swing points are marked and connected with a trend line.
We can also switch to a candlestick or a different type of chart and draw a parallel line (yellow in this case), starting at the first swing low. When the price hits the trend line, we can either sell or buy depending on whether the trend line is marking an upward or a downward trend.
This strategy can be used with various time frames, even instruments. When using this strategy, you don’t need any indicators, but it can only help you if you know candlestick patterns as they can warn you ahead of time about a changing trend.
Visual representation of the illustrative potential trading opportunity:
1) Drawing a blue trend line (explained above).
2) Drawing a yellow trend line (explained above).
3) Hitting the blue trend line and a potential entry signal.
4) Placing a Stop-Loss order 1-2 pips under the current value of the yellow trend line.
5) Placing a Profit-Target order at the level of the highest Close candlestick of the previous swing (with selling positions, it is the lowest Close candlestick) -> Be careful! Don’t confuse Close with a Swing High/Low!
Buying rules:
Selling rules:
The disadvantages of trading trend lines
Every strategy has its pros and cons. The cons when using this strategy are:
- The trend line being pushed through, followed by a change in the trend.
- The market often follows the trend line but does not hit it (in such cases, the trader must be well prepared mentally and stick with his rules, which partly protect him from potential losses!).
- With time, the market creates corrections of the trend line and changes its slope – you need to have experience and respond to the situation by redrawing the trend line.
The advantages of trading trend lines
We truly believe that the graphic illustration of the Price Action strategy will be an inspiration to you as far as approaches to trading go. We wish you many successful trades!
- It’s a strategy based on Price Action.
- The profit / loss ratio is, in some cases, very high.
- When eliminating flaws, the trader is often able to buy at the market low and sell nearly at the top of the market.
About the Author

Team Purple Trading
Purple Trading is a true and 100% fair ECN / STP forex broker providing direct access to the real market. High speed orders execution, no trade-offs, no limits for any type of trading, the most advanced trading technologies. Explore more about Purple Trading at www.purple-trading.com .
For more information on the risks of trading, click here .
P.M. Purple Trading is a trade name owned and operated by L.F. Investment Limited., 11, Louki Akrita, CY-4044 Limassol, Cyprus, a licensed Cyprus Investment Firm regulated by the CySEC lic. no. 271/15.

