Trade tunnels are a widespread tool used by traders all over the world. With tunnels, it is not only possible to predict the points at which turnovers will occur, but also when the market is either oversold or overbought.
However, it is very difficult to guess where such places are, which is why the unprecedented Tunnel Regress System trading strategy was created, where traders do not try to find exact reversal positions, but in the case of this strategy, it is possible to trade whenever the price gets to the right side of the tunnel.
Drawing and working with tunnels
Tunnels can be drawn either by hand, where either two consecutive peaks (a falling tunnel) or two troughs (a rising tunnel) are joined and then a first parallel line is drawn to these lines, representing the other side of the tunnel, before a centre line is drawn to divide the whole tunnel into trading and non-trading sides. The second way to plot tunnels is to use some tunnel plotting tools, which are usually an essential part of the platform.
In the graph below, the side of the drawn tunnel within which the inputs are implemented is coloured purple (for the ascending tunnel, the input side is at the bottom and vice versa for the descending tunnel at the top). Since it is very difficult to determine exactly where the reversals will occur, it is therefore possible to enter trades at any time when the price is on the entry side of the tunnel.
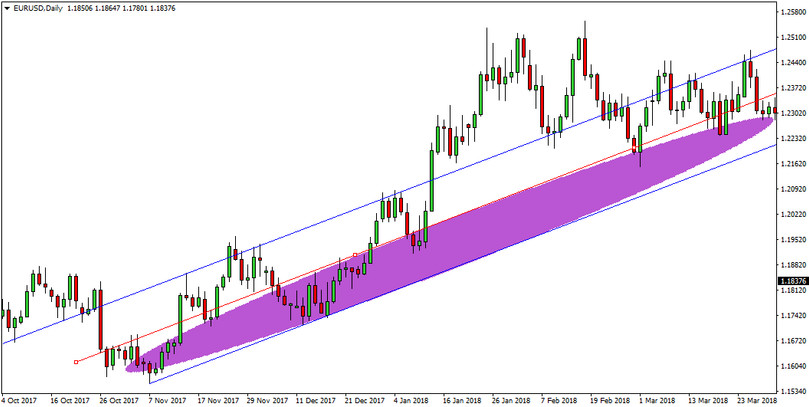
Stop-Losses are handled very simply in this strategy by placing them on any previous S/R level where the tunnel wall was hit (see below)
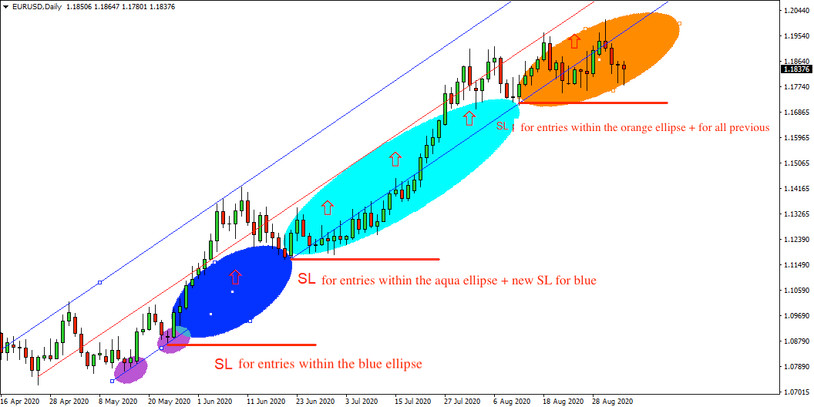
This relatively simple trading strategy achieves the best results on currency pairs and markets that tend to trend more and oscillate less. Under such conditions, it is not uncommon for this strategy to achieve success rates in excess of 80%, which is also sufficient to maintain riskier money-management.


