This trade idea was first sent to subscribers of the Free Profitable Forex Newsletter on May 19 2022.
Hey! This is Philip with this week’s edition of the Free Profitable Forex Newsletter!
The USD consolidation we warned about in our recent weekly Fx analyses and here in the newsletter is playing out this week. It now seems that it has even turned into a correction, with the DXY dollar index falling below 103.00 and EURUSD climbing above 1.05 again.
The stop on our USDJPY trade that was entered following the April 28 BOJ meeting was triggered as the pair broke and stayed below 129.00 last week. It now looks like USDJPY is also ready to correct even deeper to the downside. A technical head and shoulders pattern was completed today, and it could also fuel such a move further down. The 125.00 zone is the next important support zone to the downside and seems reachable if the dollar correction extends.
That being said, the USDJPY uptrend that started in March is still unlikely to have ended here. In fact, a return toward 130.00 sooner or later still seems probable. The 135.00 zone is not out of reach either and could still be attained over the coming months as the hawkish Fed vs dovish BOJ policy divergence is here to stay.
US economic data disappoints and triggers correction down in US Treasury yields and USD
The reasons for the dollar reversal this week are falling US yields, which were inspired by falling stock market and a series of weak economic reports from the US. Notably, Monday’s Empire State manufacturing and today’s Philly Fed manufacturing index missed expectations by a wide margin. This is a big negative surprise as these sentiment surveys are considered leading indicators for the economy and suggest that the closely watched ISM manufacturing index will also surprise negatively next month.
The falling US Treasury yields indicate that the markets are starting to ask if the US economy can really stay unharmed in the face of persistent Fed tightening and rate hikes this year. Hence, it’s not a surprise to see traders cutting back some USD long positions, especially after the large gains in recent months.
With that said, we have to keep in mind that all of this is on a very short-term scale. One week of bad economic reports will not deter the Fed from hiking rates aggressively. Not when inflation is running above 8%. Thus, the USD bull trend is still unlikely to be over yet, but the current overbought conditions combined with a reversal in short-term sentiment is enough to trigger a correction. The technicals suggest the DXY dollar index has support toward the 102.00 and 101.00 zones, while EURUSD resistance is at 1.07 - 1.08.
How can we play the USD correction? - Look at gold (XAU/USD)
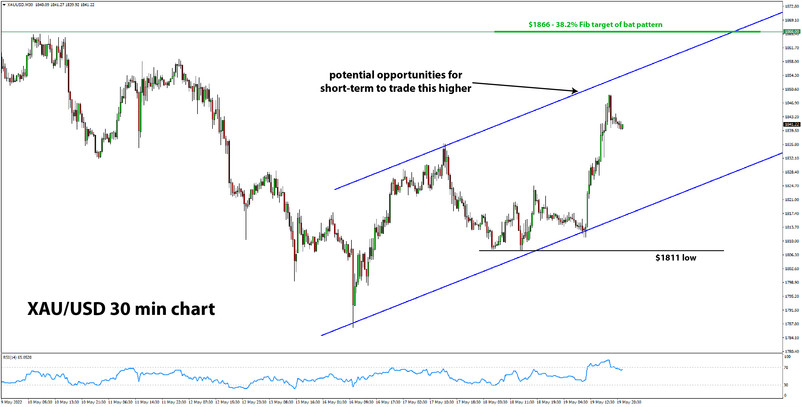
Given the environment of a hawkish Fed and general risk aversion, the best way to potentially play an extension of the dollar correction could be via precious metals, i.e., gold. The falling Treasury yields (if the decline extends) will be positive for the inflation-protective yellow metal. The technical factors will likely also play a big role as gold already fell significantly from mid-April to mid-May, so some retracement at least seems overdue. There is also a harmonic bat pattern, which was triggered this week with a harmonic support zone around the $1800 level.
Below we look at the daily chart with the details.
Based on the harmonic bat pattern, the odds seem high that this gold correction will extend higher, likely toward the 1860 - 1870 zone at least. For some of you short-term traders, this move could create opportunities to trade

However, due to the current environment of falling stock markets and still a very hawkish Fed, we can’t suggest a long XAU/USD trade idea with a more distant TP target. Therefore, although there are decent chances the gold can reach the 1900 area again (it is the 2nd target of the harmonic pattern also), the already notably diminished risk-reward (gold is already more than $50 off the lows) suggests that the risk is not worth to target the 1900 area while having a stop at 1780. We also don’t have the trend as a tailwind for this trade as it is bearish due to the large decline in the past 20-25 days. So there is no trade plan section with entry, stop, and exit levels in this edition of the newsletter.
With that being said, a potential retracement toward 1830 or 1820 could create a situation that will provide a more attractive setup to join this move. However, it’s also possible that gold will simply continue higher without retracing, in which case, this opportunity would only be appropriate for the very short-term traders.
Trade signals from the past weeks
- May 02, 2022 - Long USDJPY from 130.10, stopped out at 128.80 = -130 pips (trade idea sent April 28)
- May 16, Long EURGBP from 0.8490, holding the trade as the rebound on weekly chart suggests the breakout is intact (open, in progress)
TOTAL P/L in the past week: -130 pips
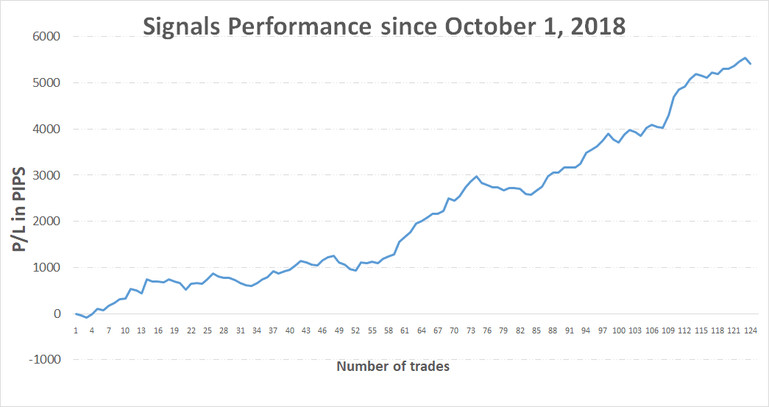
TOTAL: +5410 pips profit since October 1, 2018


![USD Correction Underway; [Free Forex Newsletter, May 19]](https://cdn.investworld.net/insecure/w:835/h:407/rt:fit/g:ce:0:0/el:1/f:jpg/c:0:0/q:90/czM6Ly9zZXJ2aWNlcy0tODM1OS0taW1hZ2VzL2E1OTdmZTQ4ZTYzNDNkY2FiMjBhMDg3OTZkMTk5NDIzNmU4YmIyMDIucG5n.jpg)


