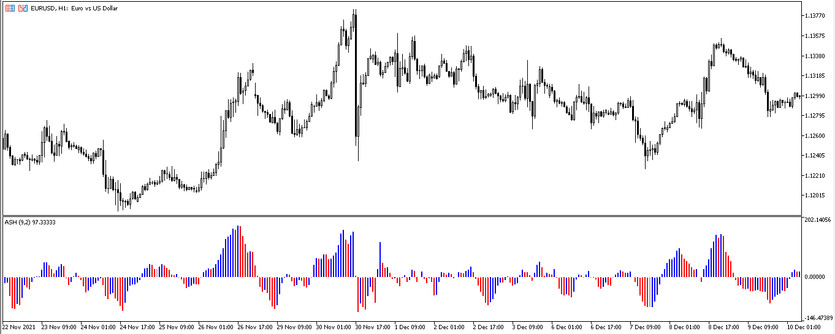
ASH-forex indicator, which is an algorithm for determining the current market trend, as well as identifying the optimal points for opening positions. The indicator makes calculations by calculating the difference in the strength of buy and sell positons. ASH is located in the bottom window of the chart, where its signals will be displayed. It is a histogram with three colors, each of which will indicate the current direction of the market movement. The indicator can be used with any currency pair on any timeframe.
Input parameters
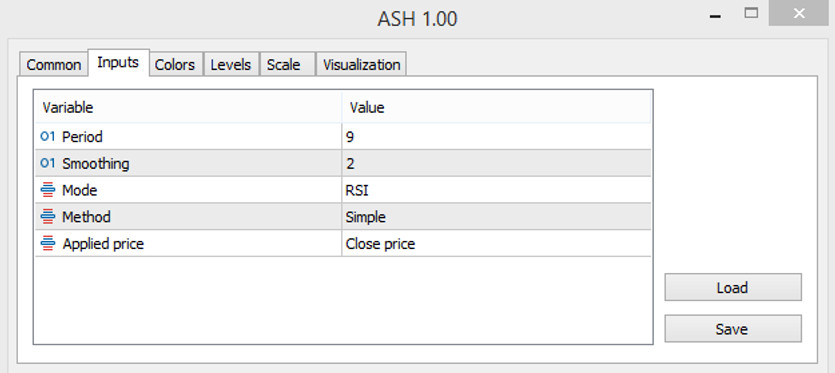
ASH has a relatively small number of parameters contained, but each of them generally affects the operation of the indicator, so this should be taken into account when changing parameters.
- -Period - indicator calculation period. The default value is 9.
- -Smoothing - value for smoothing indicator calculations. The default value is 2.
- -Mode-parameter for selecting an additional indicator that will determine trade entry points. The default value is RSI.
- -Method - the type of moving averages that apply the calculation as part of the indicator. The default value is Simple.
- -Applied price - the price that will be used in the calculation of the indicator. The default value is Close price.
As in the parameters of most indicators, ASH has access to change the color range and width of its histogram, and additional levels can be added for more accurate signals.

Indicator signals
Using ASH is not difficult, since the indicator independently generates a signal by sending it to the main window of the price chart, after which it just be needed to open a certain position.
Signals for Buy trades:
- -The histogram of the indicator changes color and acquires a value of growth.
- - In this case, the columns cross level 0 from the bottom up.
On a signal candle, taking into account the conditions for a buy trade, a long position can be opened. When a reverse signal is received, that is, when the color of the histogram columns changes, the trade should be closed after setting a take profit.
Signals for Sell trades:
- -The indicator bars after an uptrend change color and acquire a falling value, which characterizes the beginning of a downtrend.
- -The histogram of the indicator crosses the level 0, heading down.
A short position is opened on the current candle. After placing a take profit, when a reverse signal is received, the trade should be closed.
Conclusion
Absolute Strength Histogram is an algorithm for successful and simple trading. But it does not deny the presence of false signals. Therefore, it is recommended to use the indicator with additional tools. Also, for the competent and correct use of the indicator, it must be had the skills to use it, which can be acquired through the use of a demo account.


