The BW Market Facilitation Index indicator is a convenient indicator by which the state of the current market trend is assessed. Measurement is carried out on the basis of a comparison of changes in price and volume for a certain time period. The author of this tool is the legendary trader Bill Williams, who described it in his book Trading Chaos. The analyst claims that the market facilitation index he developed models the situation more objectively than all modern stochastic oscillators and trend indicators.
Indicator calculations.
The MFI indicator is calculated as the ratio of the difference between price extremes to the volume of a bar in one tick. By itself, this indicator does not have much significance. Its true value can be determined only in comparison with the previous index. It is on the basis of this comparison that they evaluate the measure of market readiness for new price challenges.
The index is intended to determine market behavior after a sharp or slight change in volume. It is calculated by a simple formula:
MFI = (High - Low) / Volume.
High is the maximum price value for a certain period, and Low is the minimum value.
For example, if the current Market Facilitation Index is larger than its predecessor, then there has been a rise in price movement per tick, and, accordingly, market facilitation has increased.
Based on the information received, it is possible to determine the approximate level of trading opportunities in a specific time period. An important advantage of the indicator is its attachment to current volatility, which allows it to be assessed as objectively as possible, in accordance with the real situation on the market.
Indicator signals.
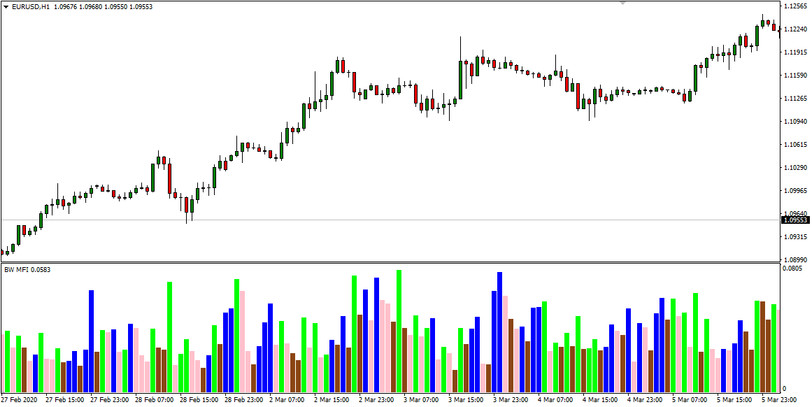
By default, the colors of the bar graphs of the indicator are colored in green, brown, blue, and pink.
Green - means that at this time interval, both MFI and volume showed growth. A green column is drawn with a growing index and volume. At this moment, there is an active market movement along with a certain trend. The number of transactions made by traders is constantly increasing, and quotes continue to move in the selected direction. For entry to the market, this bar is useless as the optimal point has already been missed, and opening a deal is already very risky. Green bar confirms the correctness of the decision.
Brown - both MFI and volume have declined. A brown bar appears when the volume and indicator values drop. It shows the trader that the market is gradually slowing down. In the trade it is used only as additional information.
Blue color - MFI is growing, the volume is falling. A blue bar signals that market activity is increasing, but volumes are decreasing. For deals, it is not applicable.
Pink - MFI drops, volume grows. The appearance of a pink bar occurs with a decrease in MFI and an increasing volume. It signals the completion of market movement in the selected direction. This bar ends all the trends.
Conclusion.
The BW MFI indicator divides market fluctuations into four components, conveniently indicated by various colors. The tool does not require adjustment, automatically adjusting to the timeframe. Both factors make it easy to use the indicator for both novice traders and professionals.